The Changing Business of America’s Gas Utilities

In 2026, Americans are spending a lot more on fuel than we used to. This includes pipeline gas used to heat homes and hot water, cook food, and dry laundry. Volatile fuel prices are compounding with a decade of accelerating pipeline replacement spending. Both of those trends make gas utility bills particularly vulnerable to significant rate increases year over year. In many states, pipeline gas bills have risen by 6% annually over the last five years (such as New York and Maryland), and as high as 8% in Illinois and 10% in Massachusetts.
Advanced Energy United wanted to understand how macro-level trends in pipeline gas consumption, state by state and utility by utility, might be affecting household and business costs. Armed with this understanding, we may be better equipped to focus our efforts on resolving some of the biggest affordability policy questions of our era. To do so, we compiled Energy Information Administration data from 15 states and 37 utilities (primarily the largest utilities in states that United works in) related to the number of residential and commercial customers, average pipeline gas sales per residential and per commercial customer, and total residential and commercial sales.
When producing the graphs below, we made sure to normalize for year-to-year weather variations. We also included linear trendlines in some of the charts to illustrate the overall direction of the metric from the beginning of the data’s availability (in most cases, from the year 2000 onward). This means that the trendlines do not reflect the effectiveness of any policy interventions or changing circumstances within the last few years. In some cases, certain utilities experienced bigger jumps in the number of customers or sales that are harder to explain – we attribute many of these to data inconsistencies or utility merger and acquisition activity and do not attempt to detail each instance. We do not describe how overall state population growth or shrinkage correlates with customer count and total sales statistics, though population should not affect average usage per customer.
At a high level, the data reveals:
- The number of residential customers remains flat or continues to increase in most states and utility territories included here.
- Residential sales per customer is down in most states, Nevada’s Sierra Pacific Power Company sales per customer have remained flat, and Michigan’s DTE, South Jersey Gas, Consolidated Edison, and Southern Connecticut Gas Company/Connecticut Natural Gas have increased.
- Total residential sales are up in most states, though some utilities in California (Pacific Gas & Electric and Southern California Gas), Colorado (Xcel), Michigan (Consumers), and Illinois (Ameren, Peoples, and Nicor) show early or slight downward trends.
- The number of commercial customers increases for most utilities and remains flat in the rest.
- Commercial sales per customer are down in most states, except New Mexico and Rhode Island. New Mexico Gas Company has seen increased sales per customer, while National Grid Rhode Island has remained flat.
- Total commercial sales are down in most states, except New Mexico. New Mexico Gas Company has seen an upward trend.
Given the modest decline in pipeline gas use per residential and commercial customer in many utility territories included here, it is unfortunate that average monthly bills are up. This means that customers are paying more for less product – a finding that aligns with our understanding of accelerating spending on pipeline expansion and replacement projects. Since 2011, gas utilities have increased capital spending for pipeline projects by 200%.
We expect this divergence between pipeline spending and usage to continue as consumption declines due to energy efficiency efforts and ongoing electrification of end uses. Long term, we expect more gas customers will full electrify, that is, replace all gas appliances in a building with electric options, such that the customer is no longer a gas utility customer. This, in turn, will begin to bend the “number of customers” curve, further exacerbating affordability issues for those still connected to the pipeline system. The EIA data shows that because most states have not yet entered a period of more rapidly declining customer counts and sales, there is still time to get ahead of the challenge. For the utilities already seeing declines in sales – the best time to act was yesterday. The next best time is today.
Number of Residential Customers

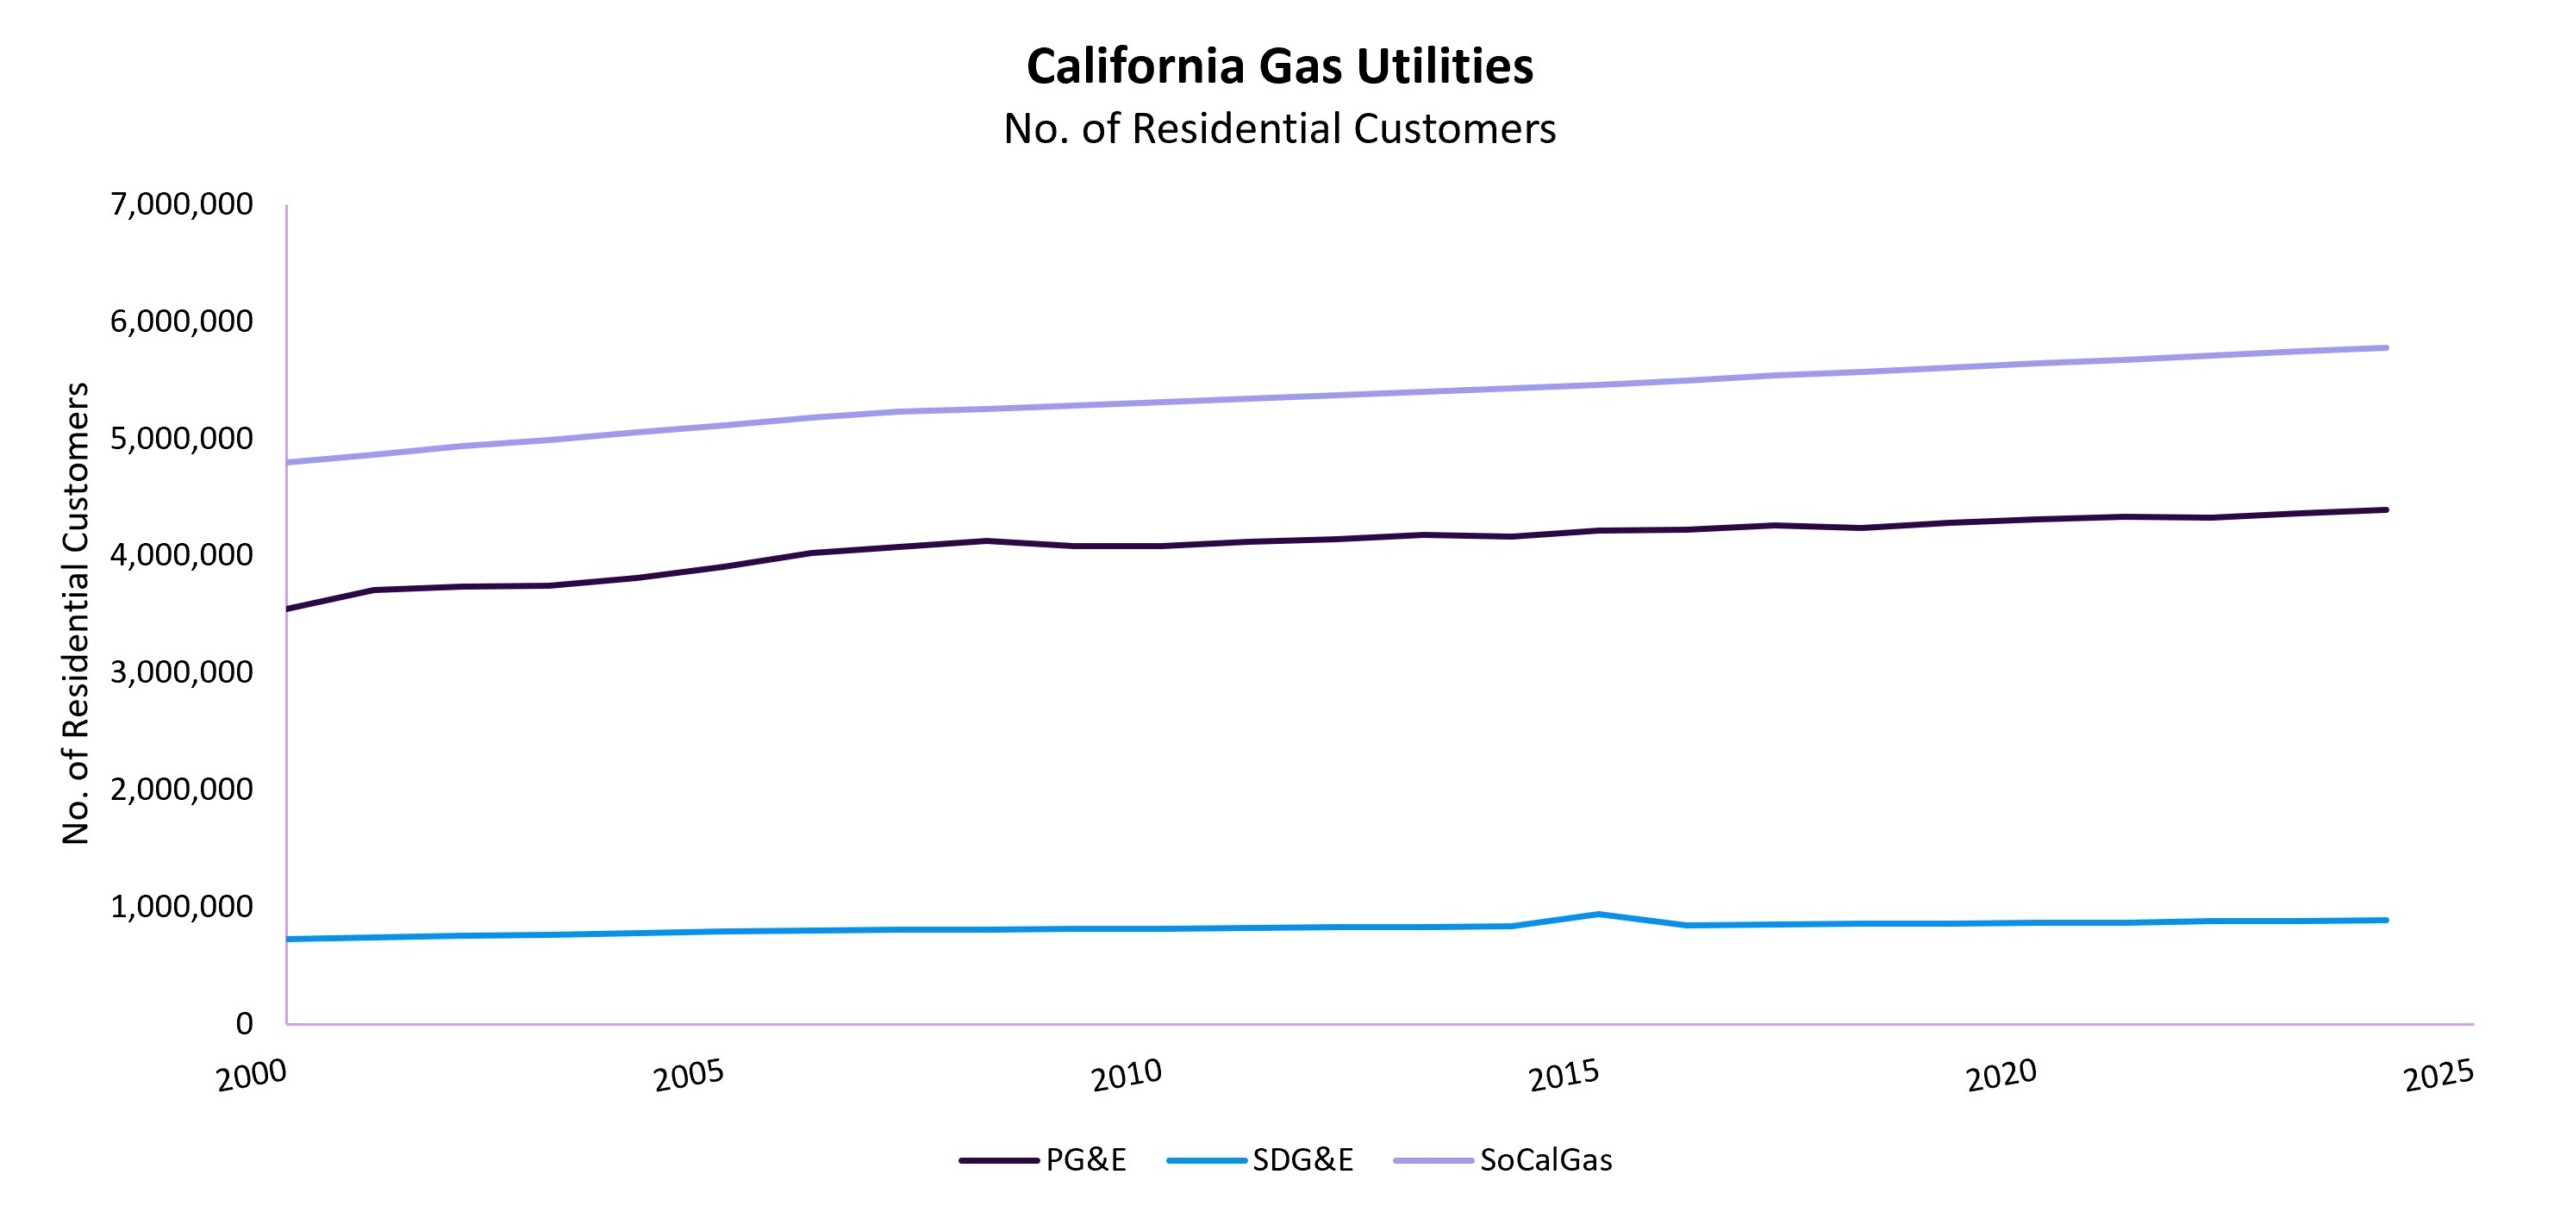
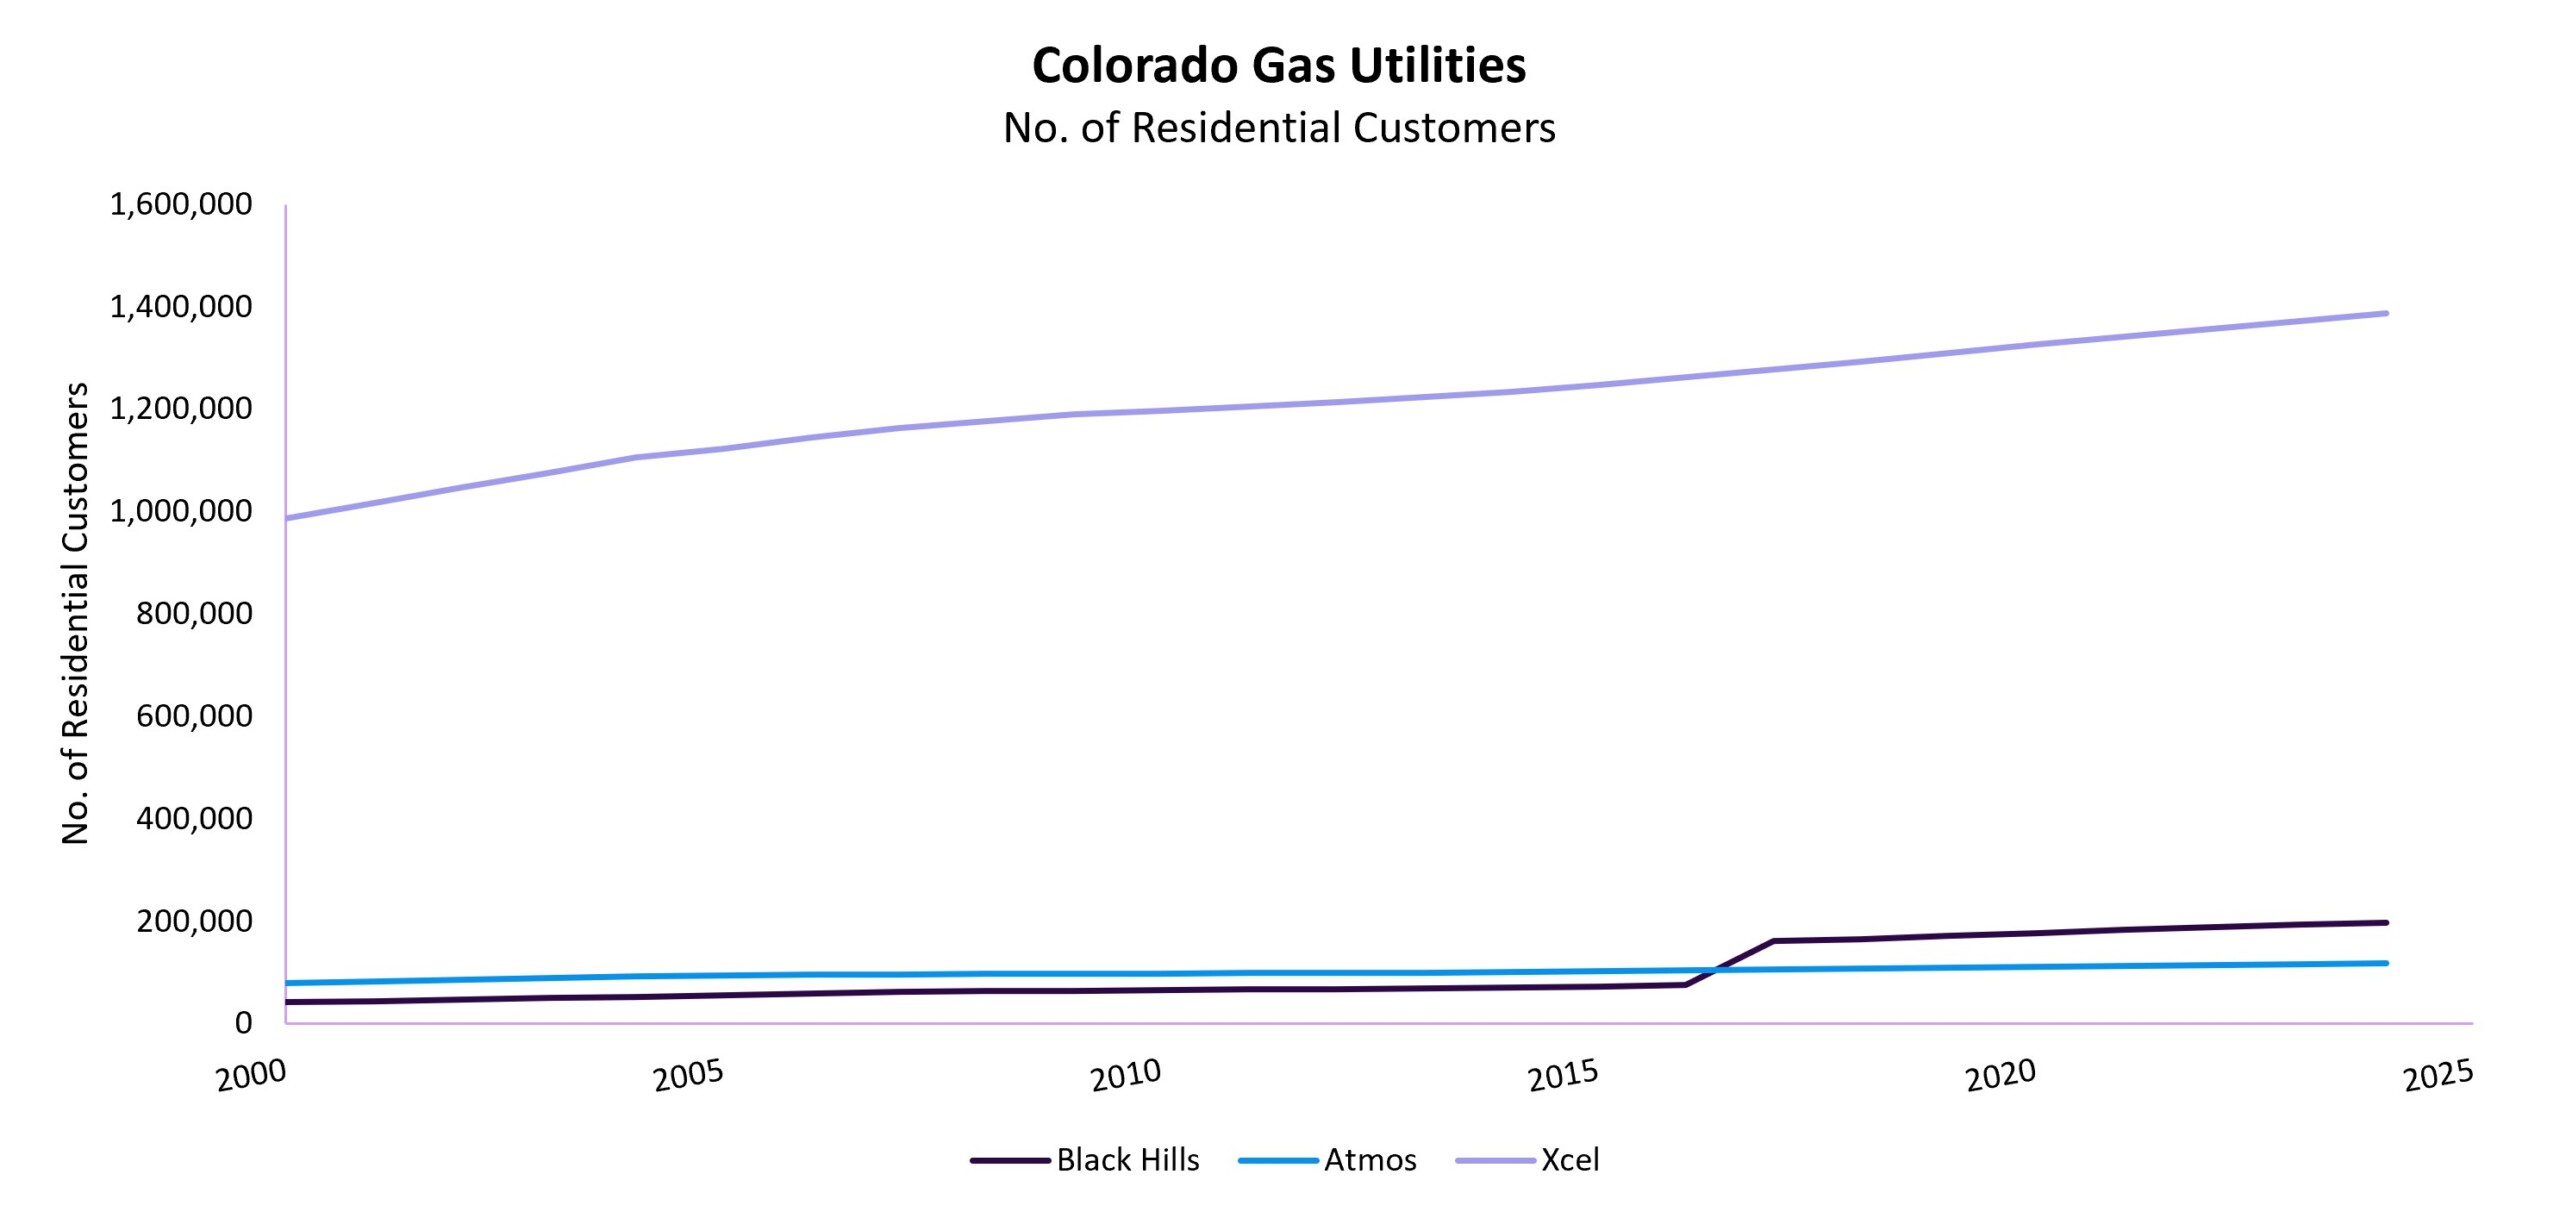
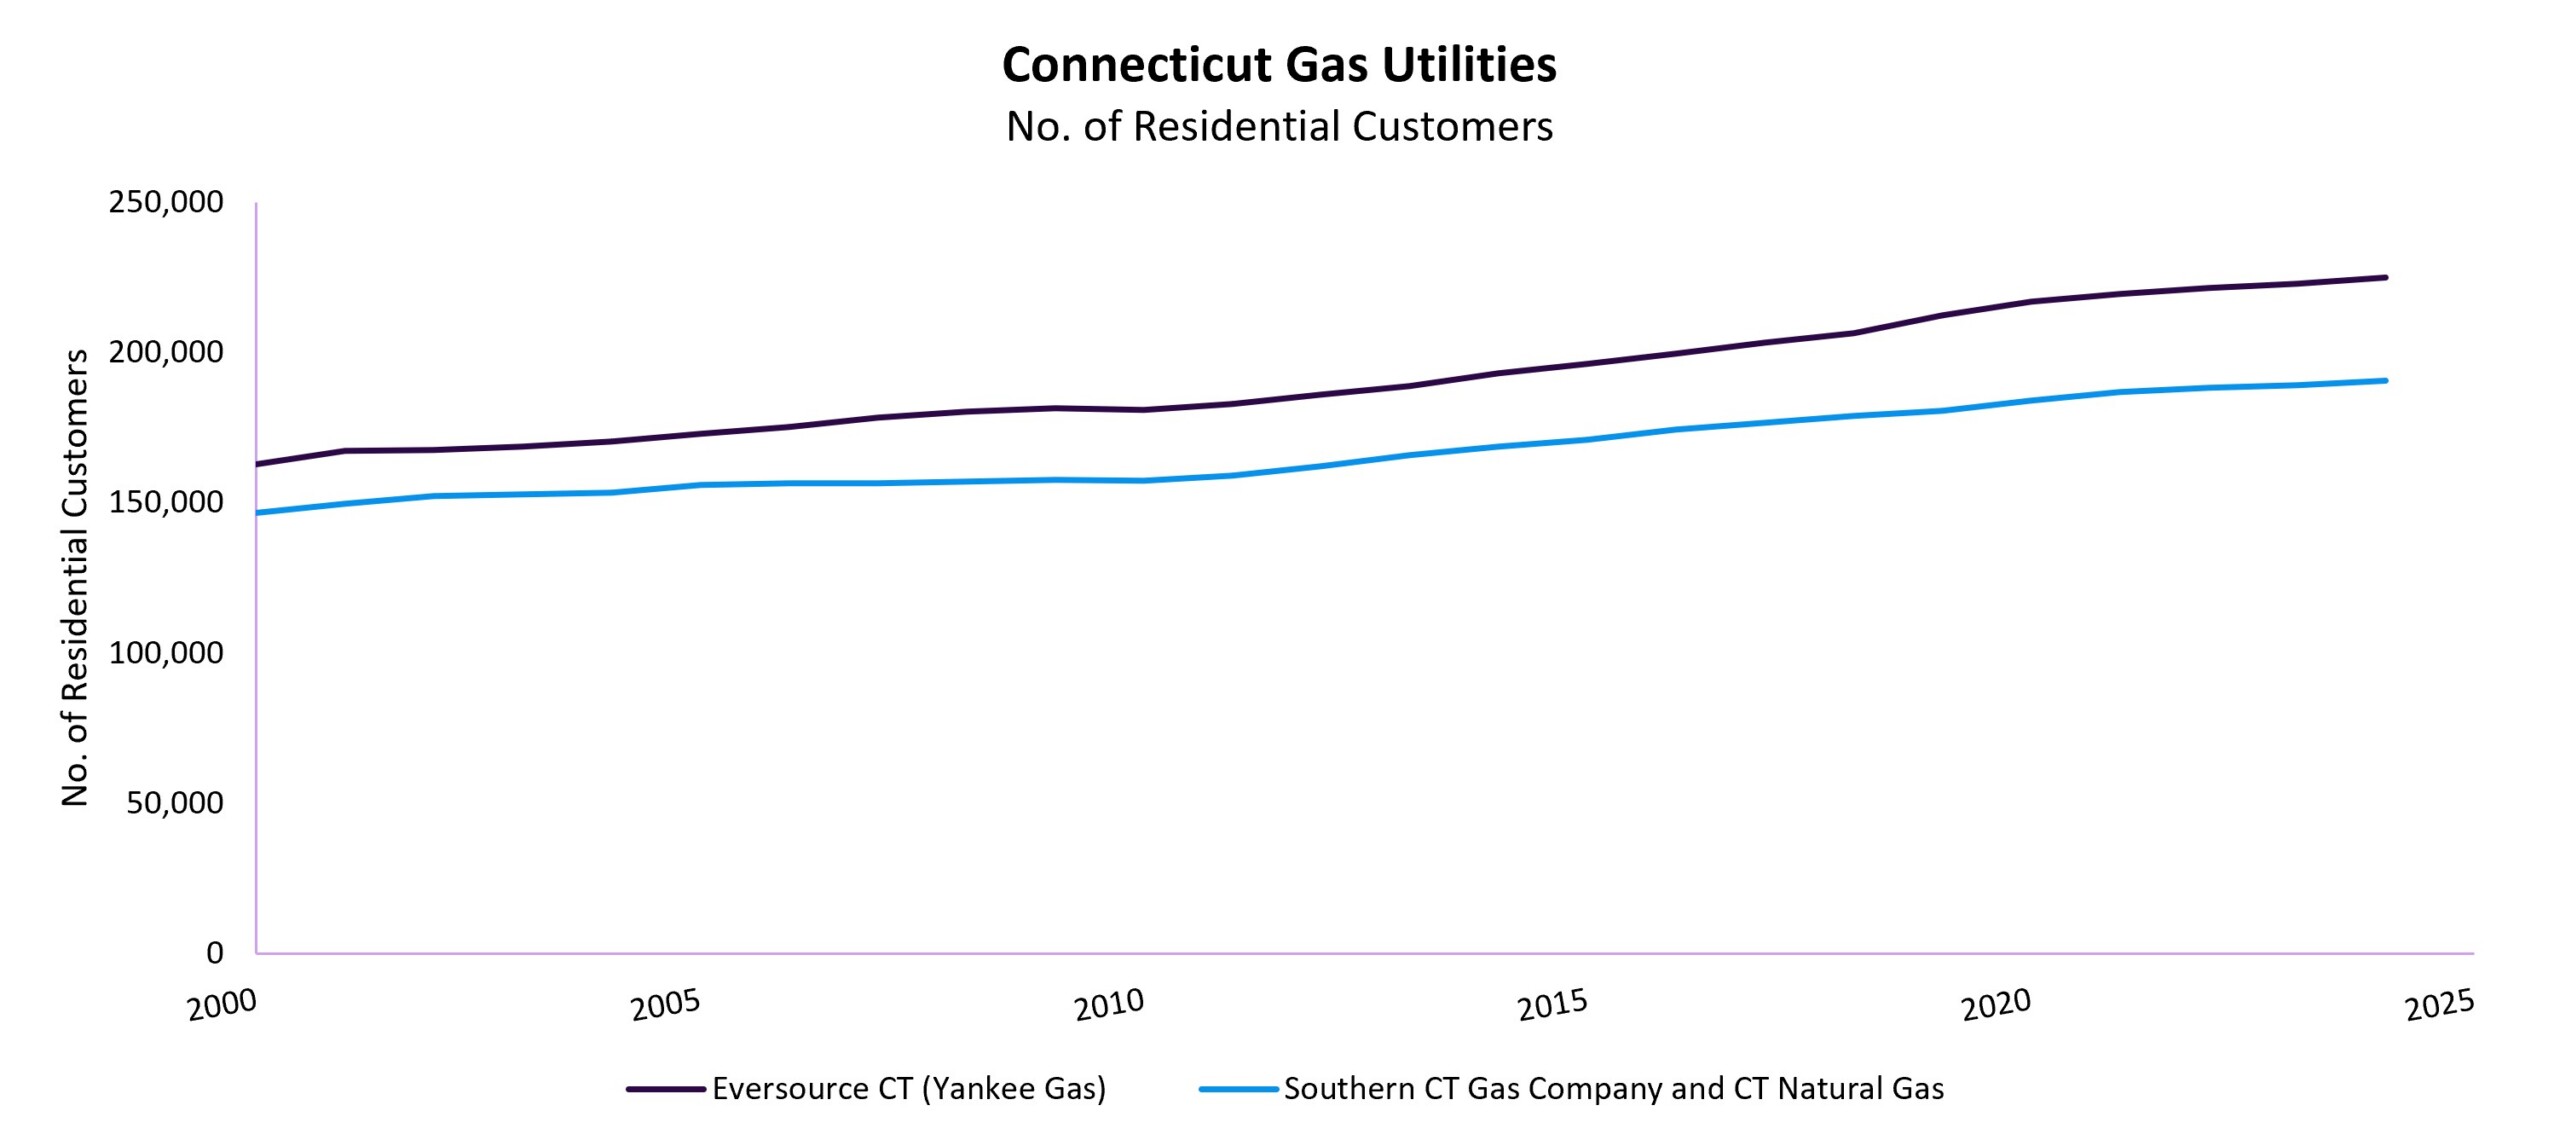
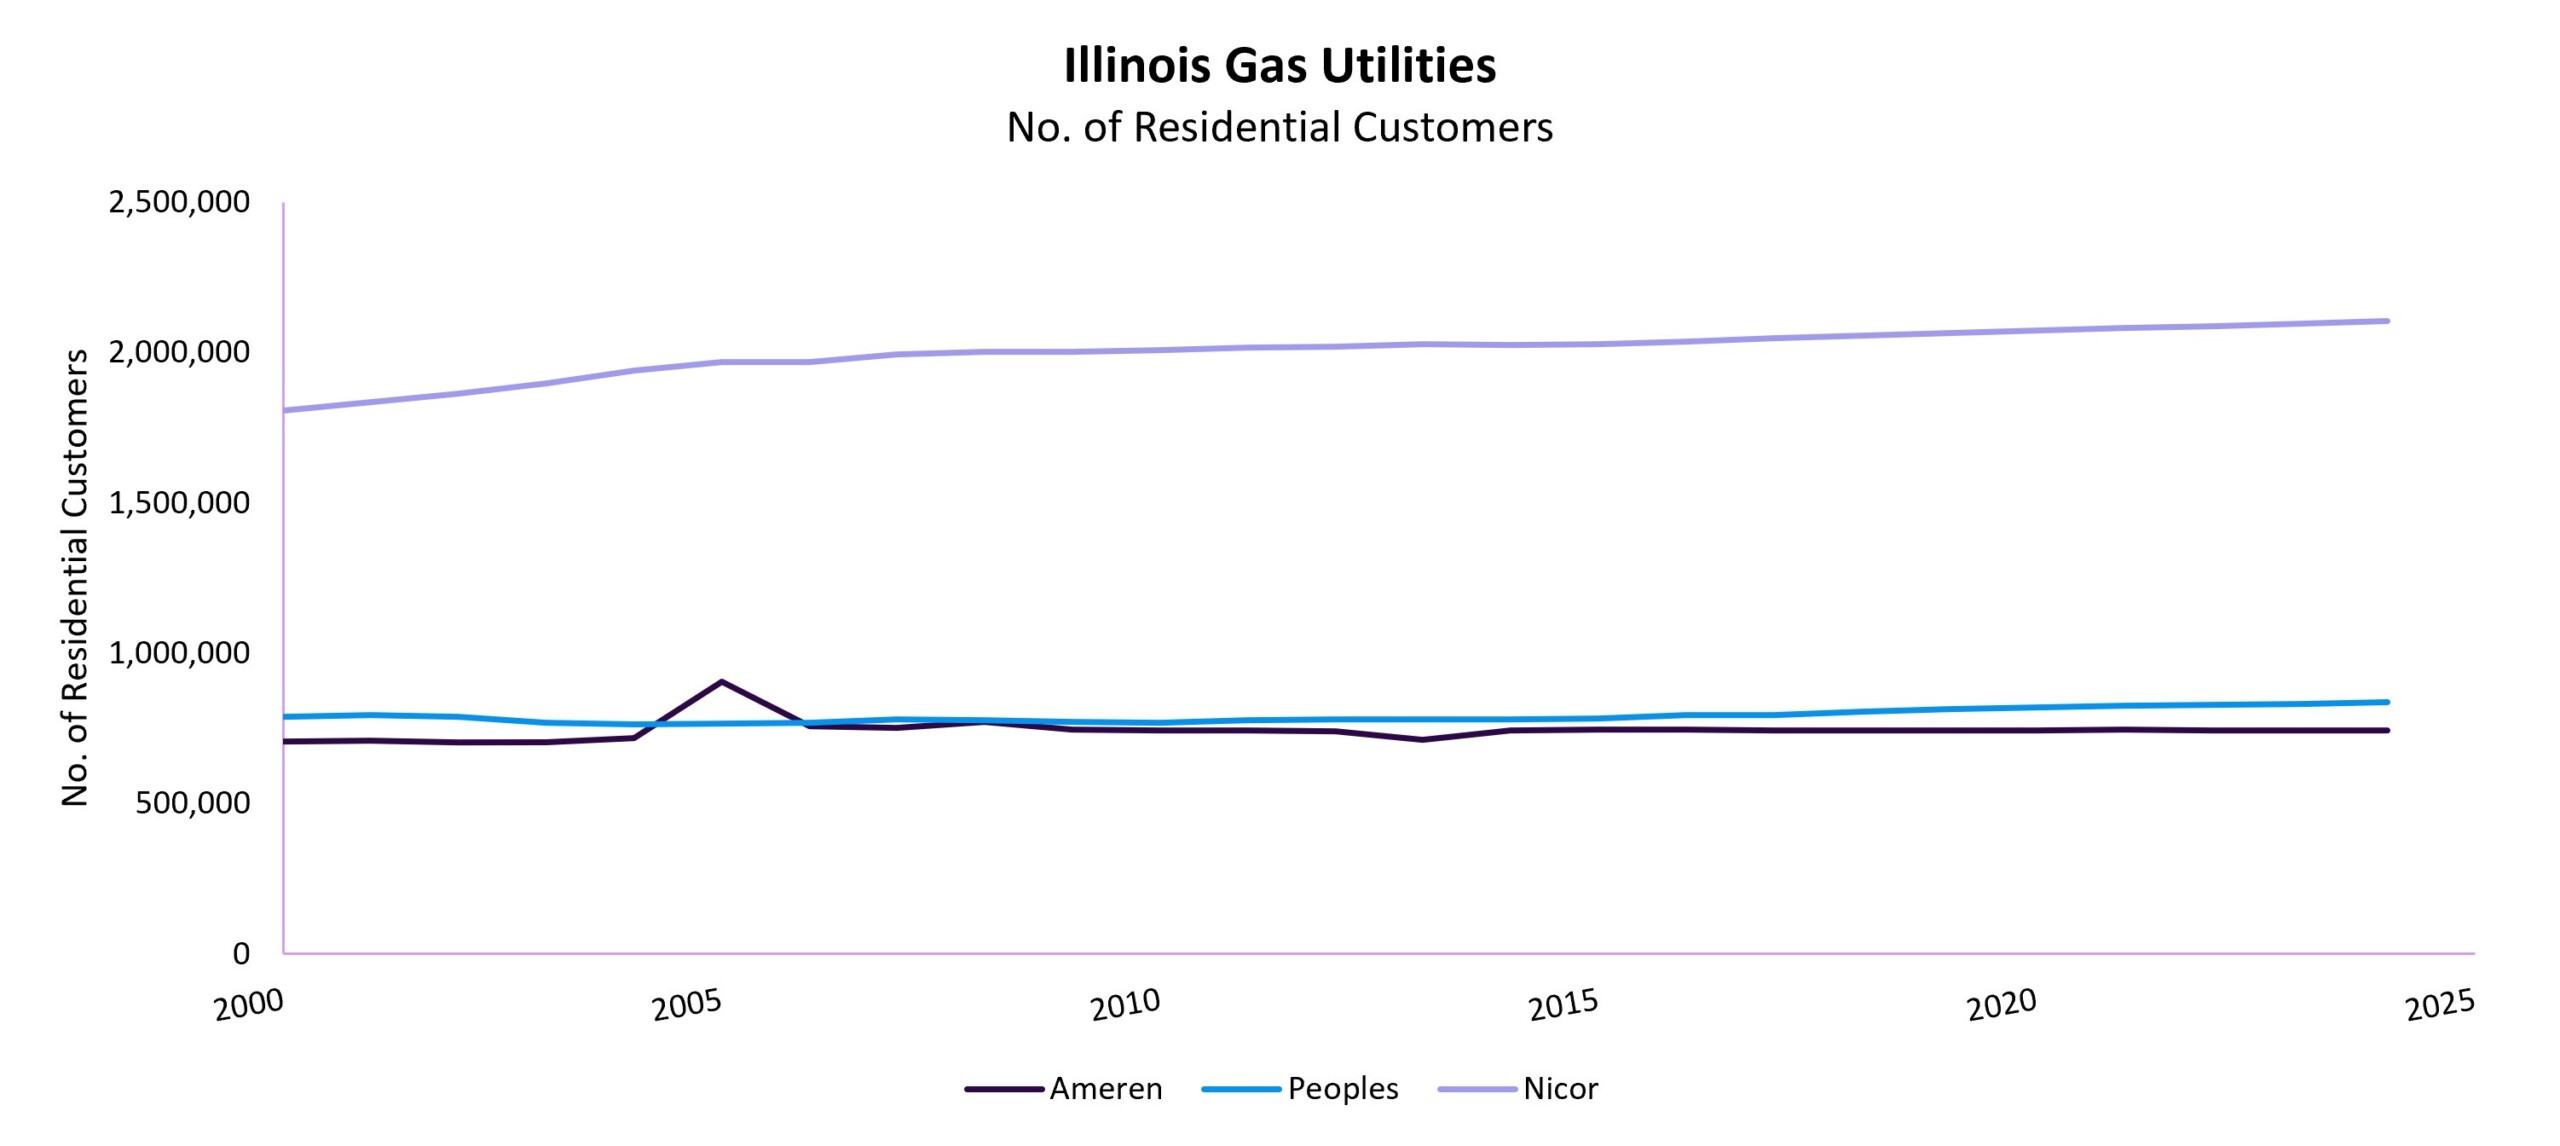
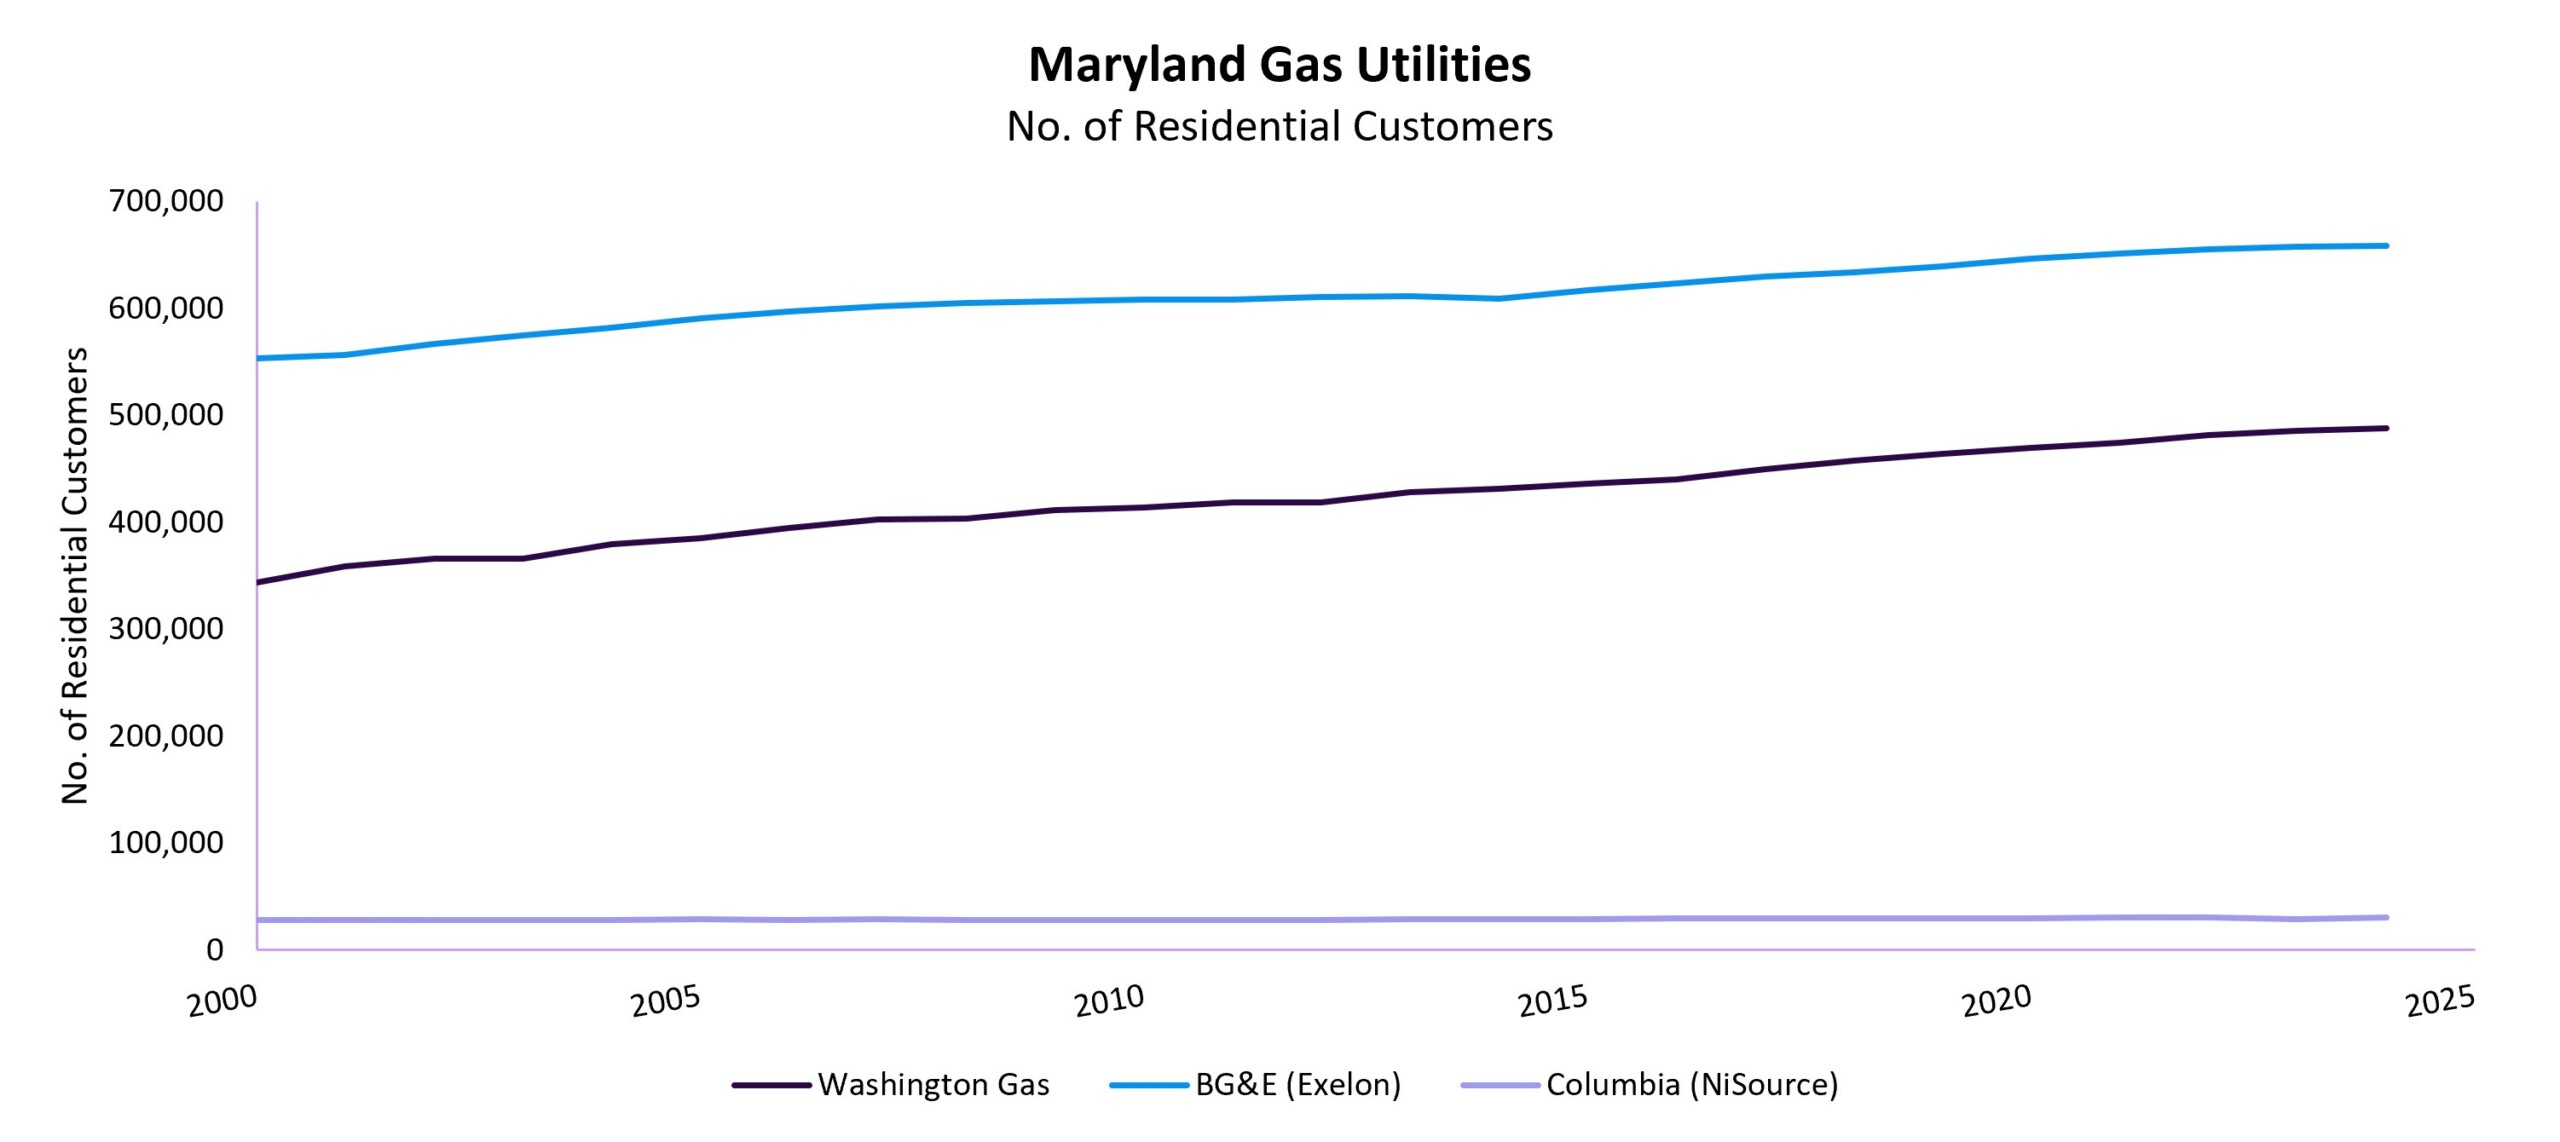
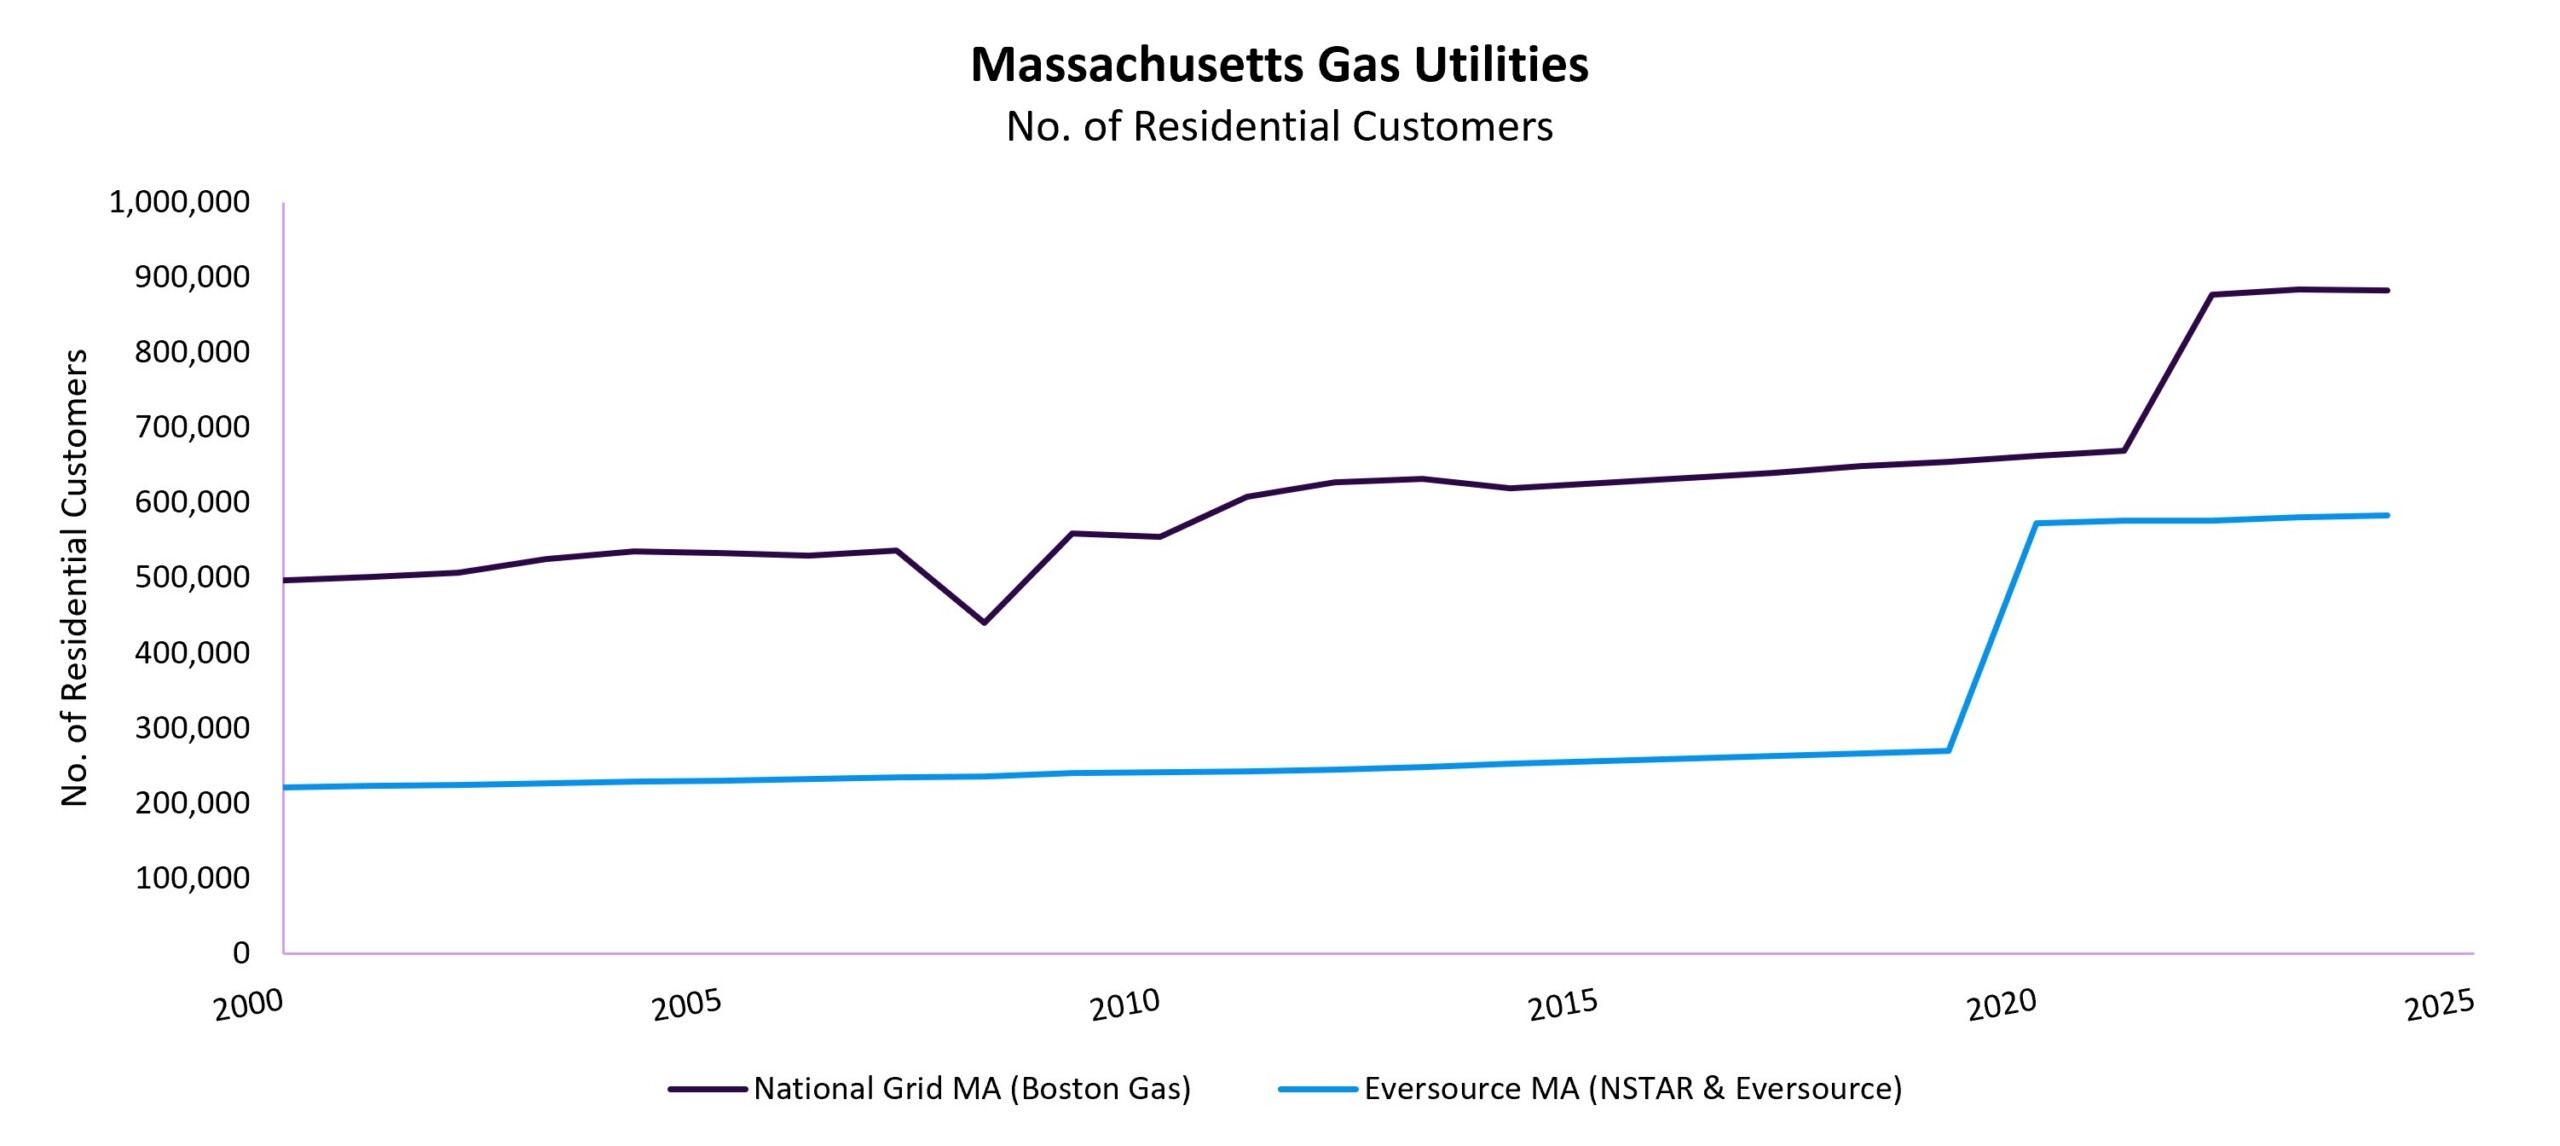
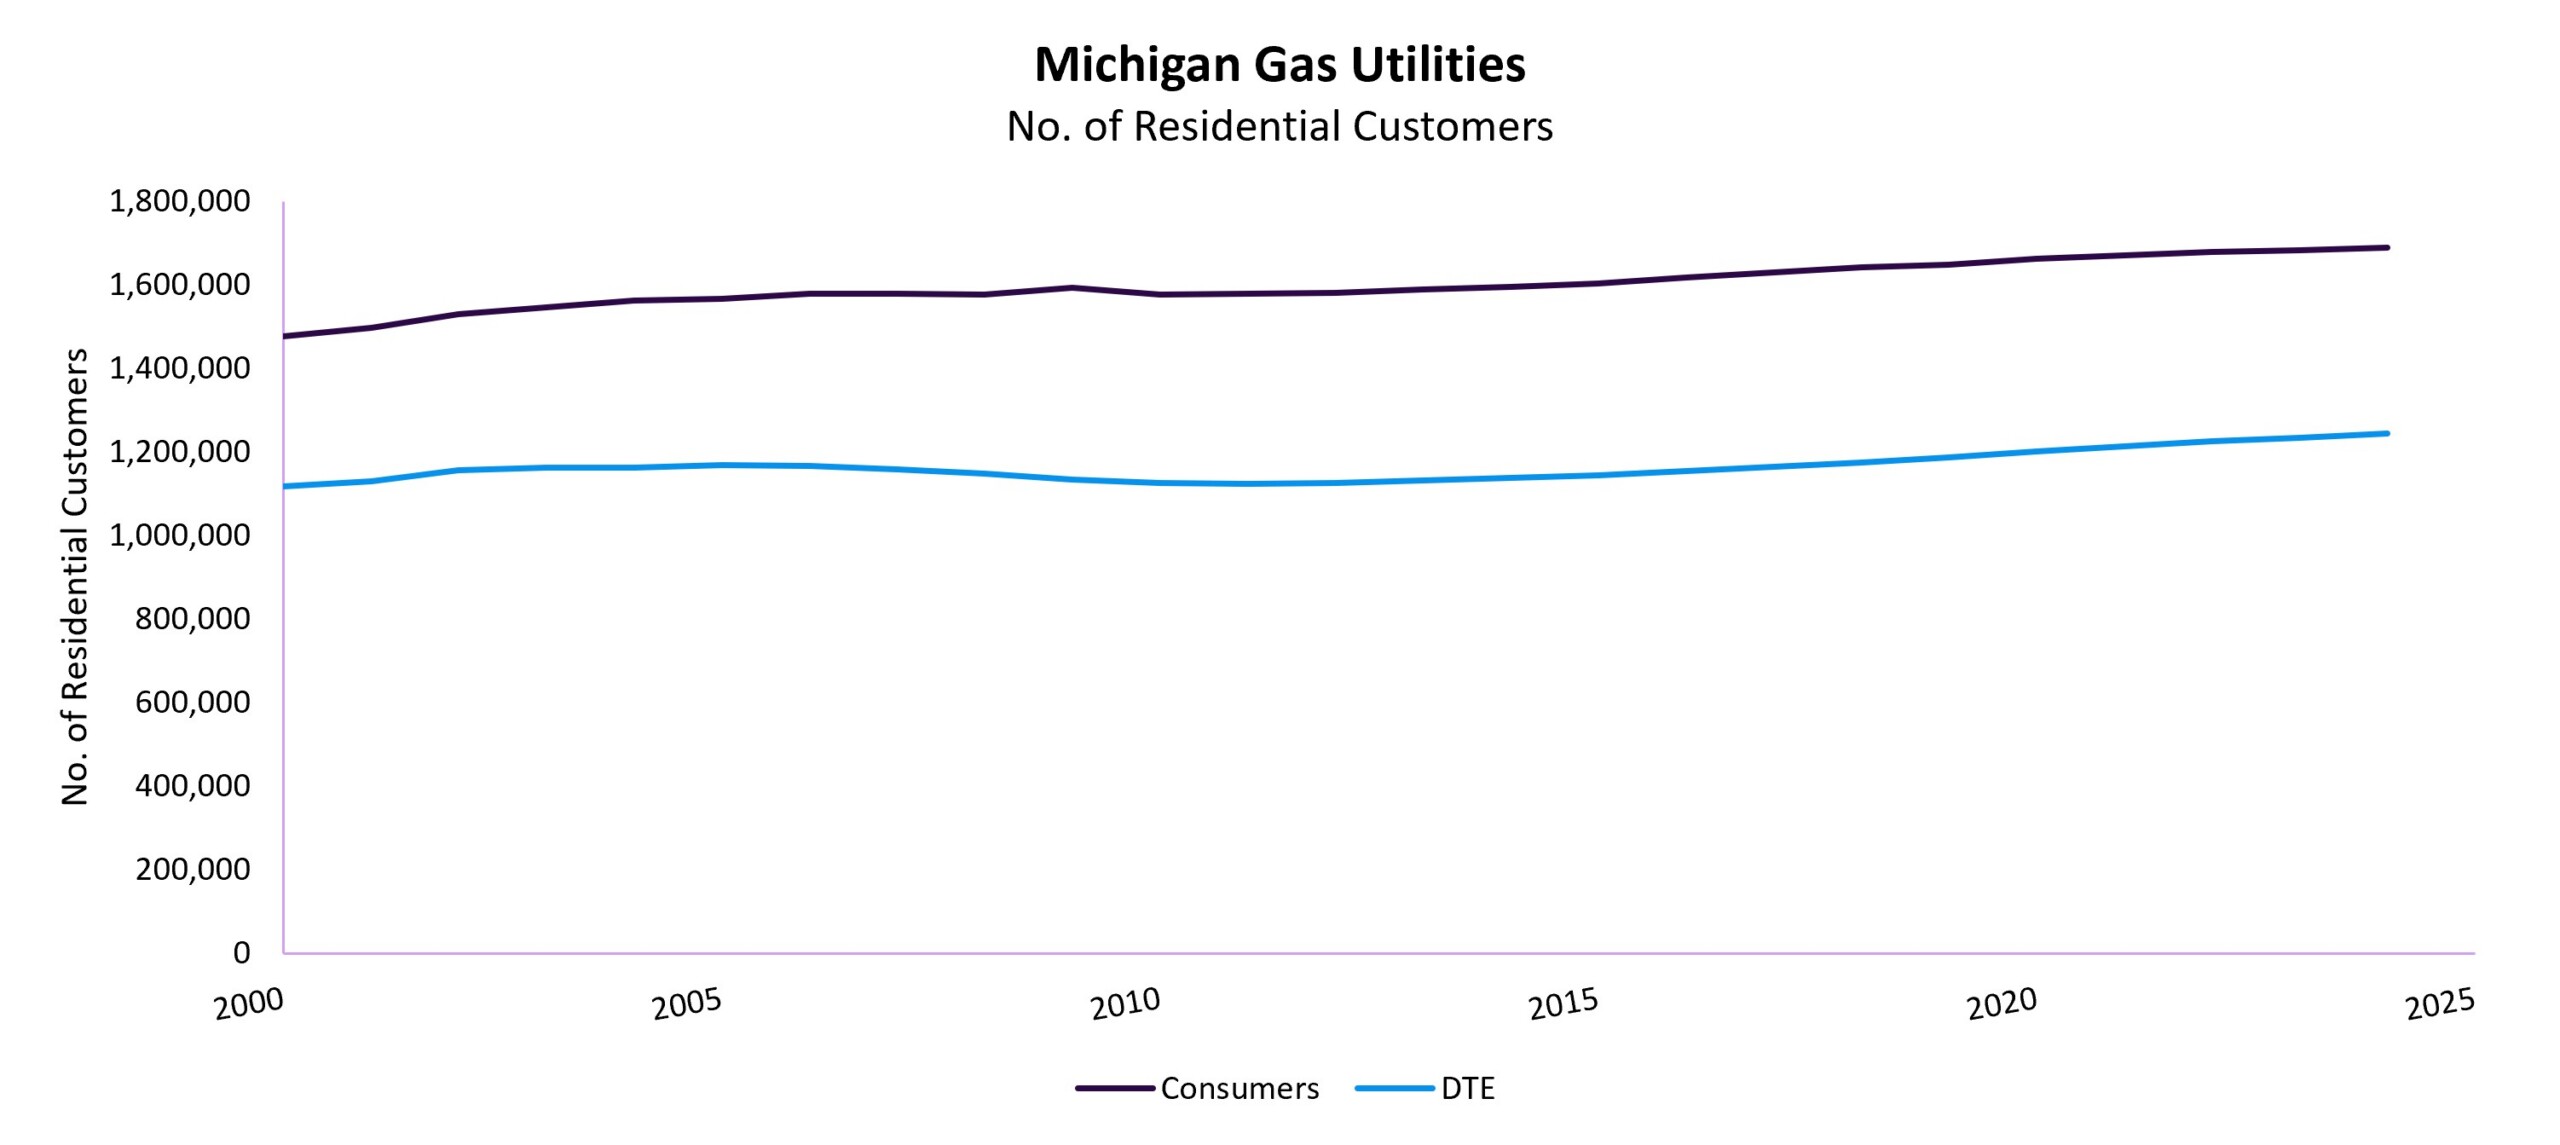
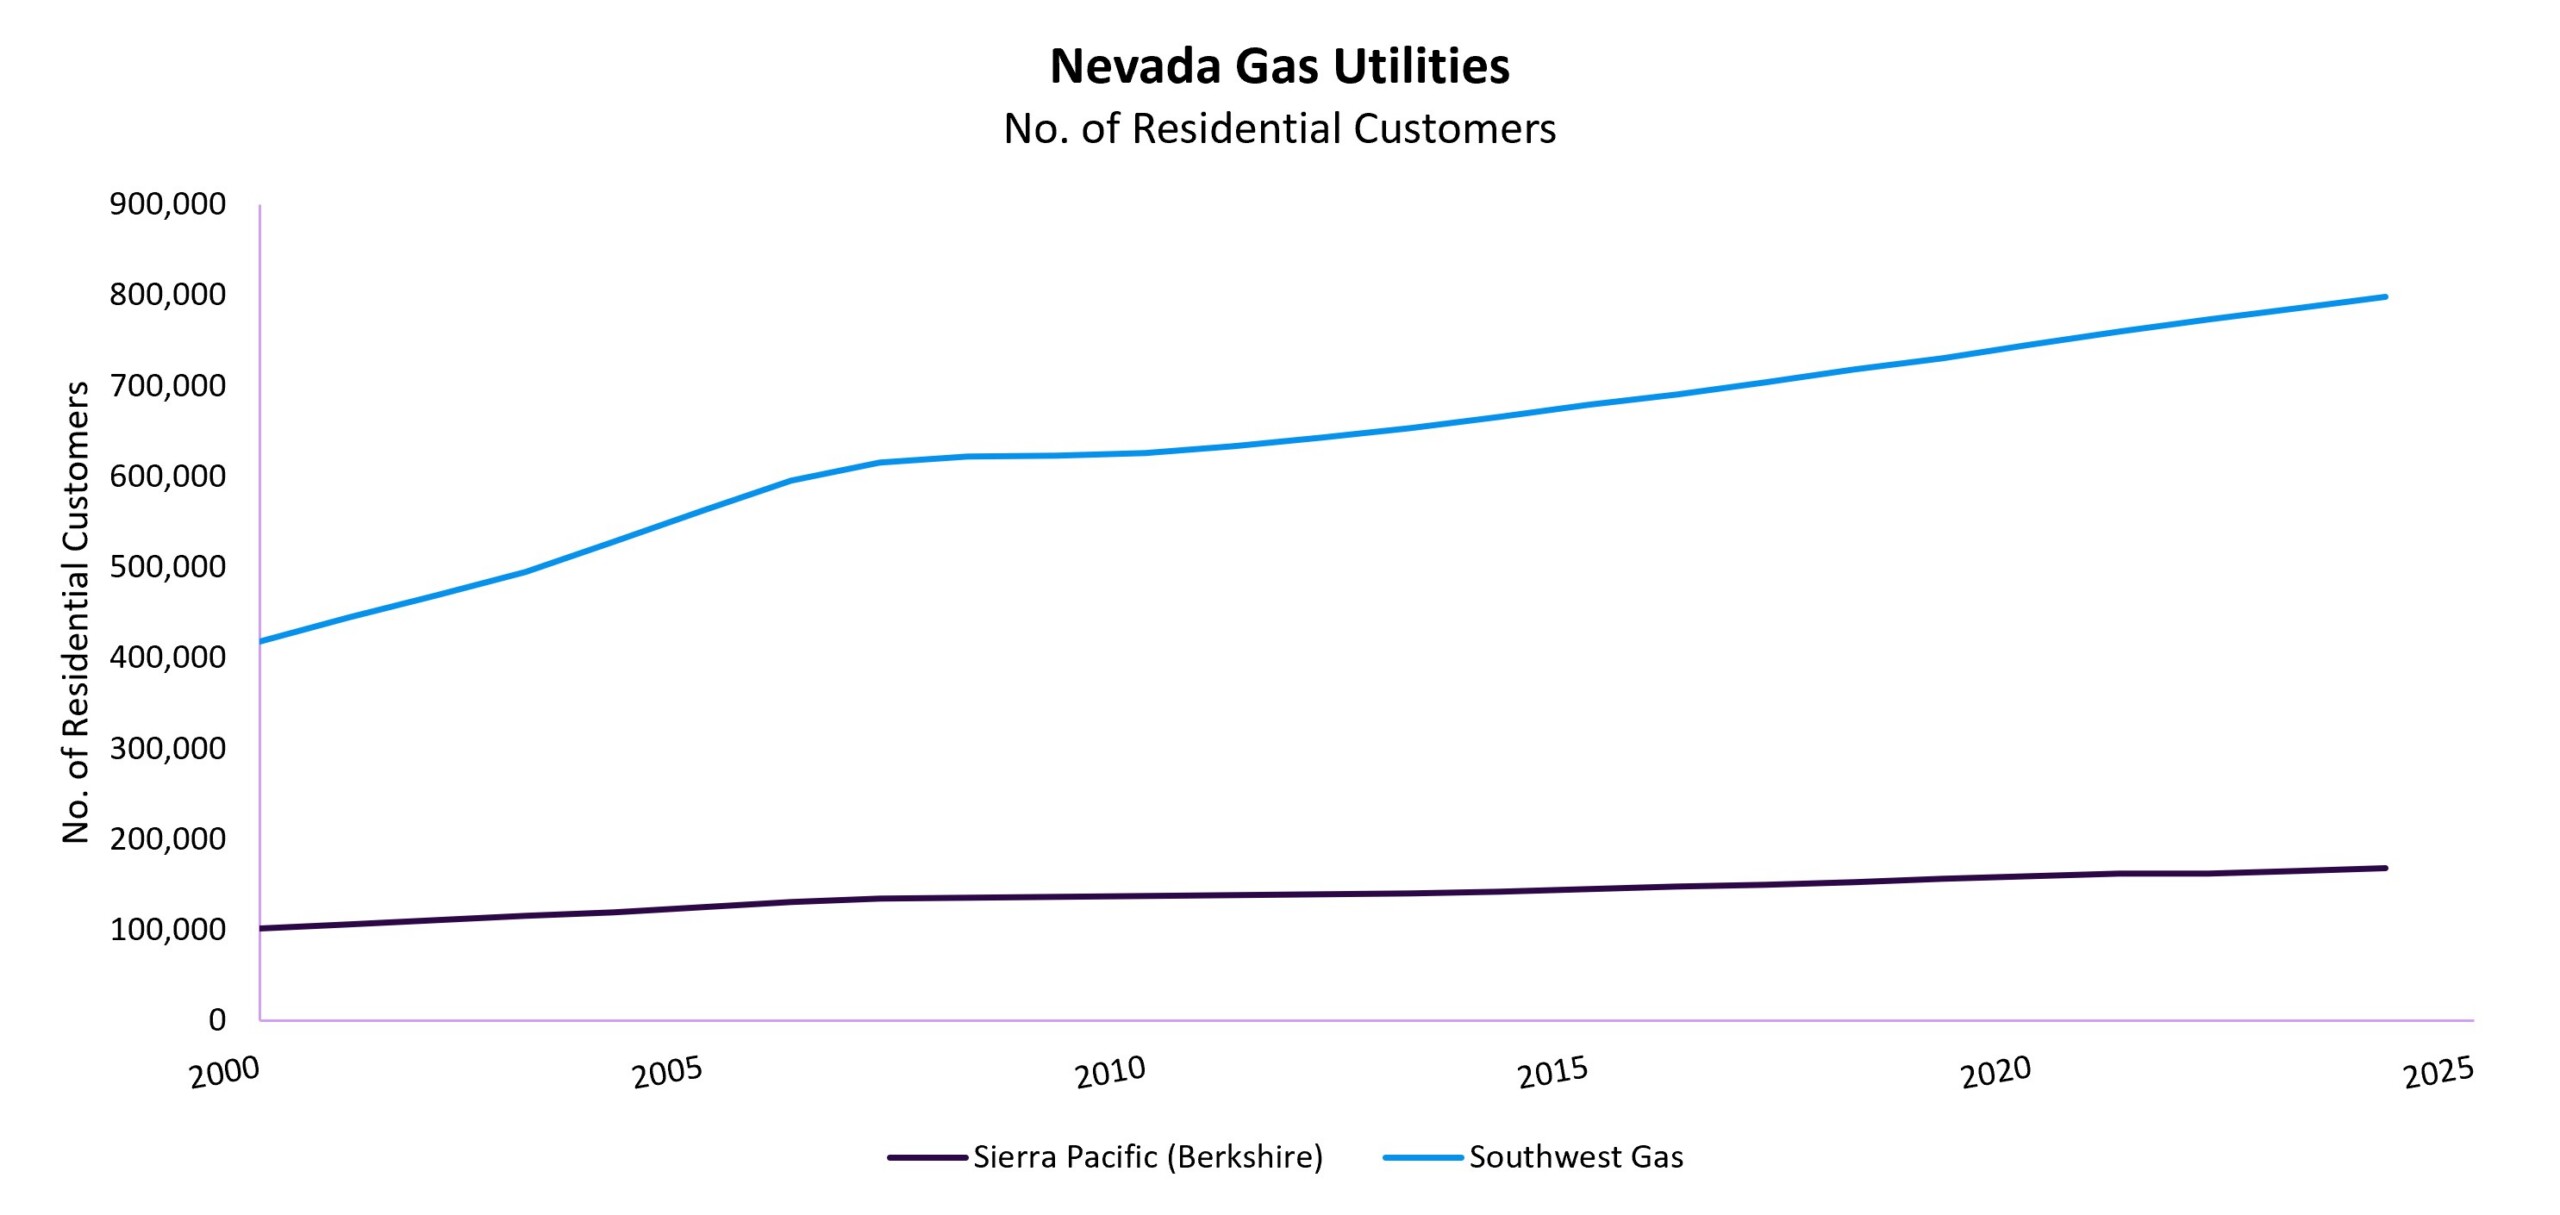
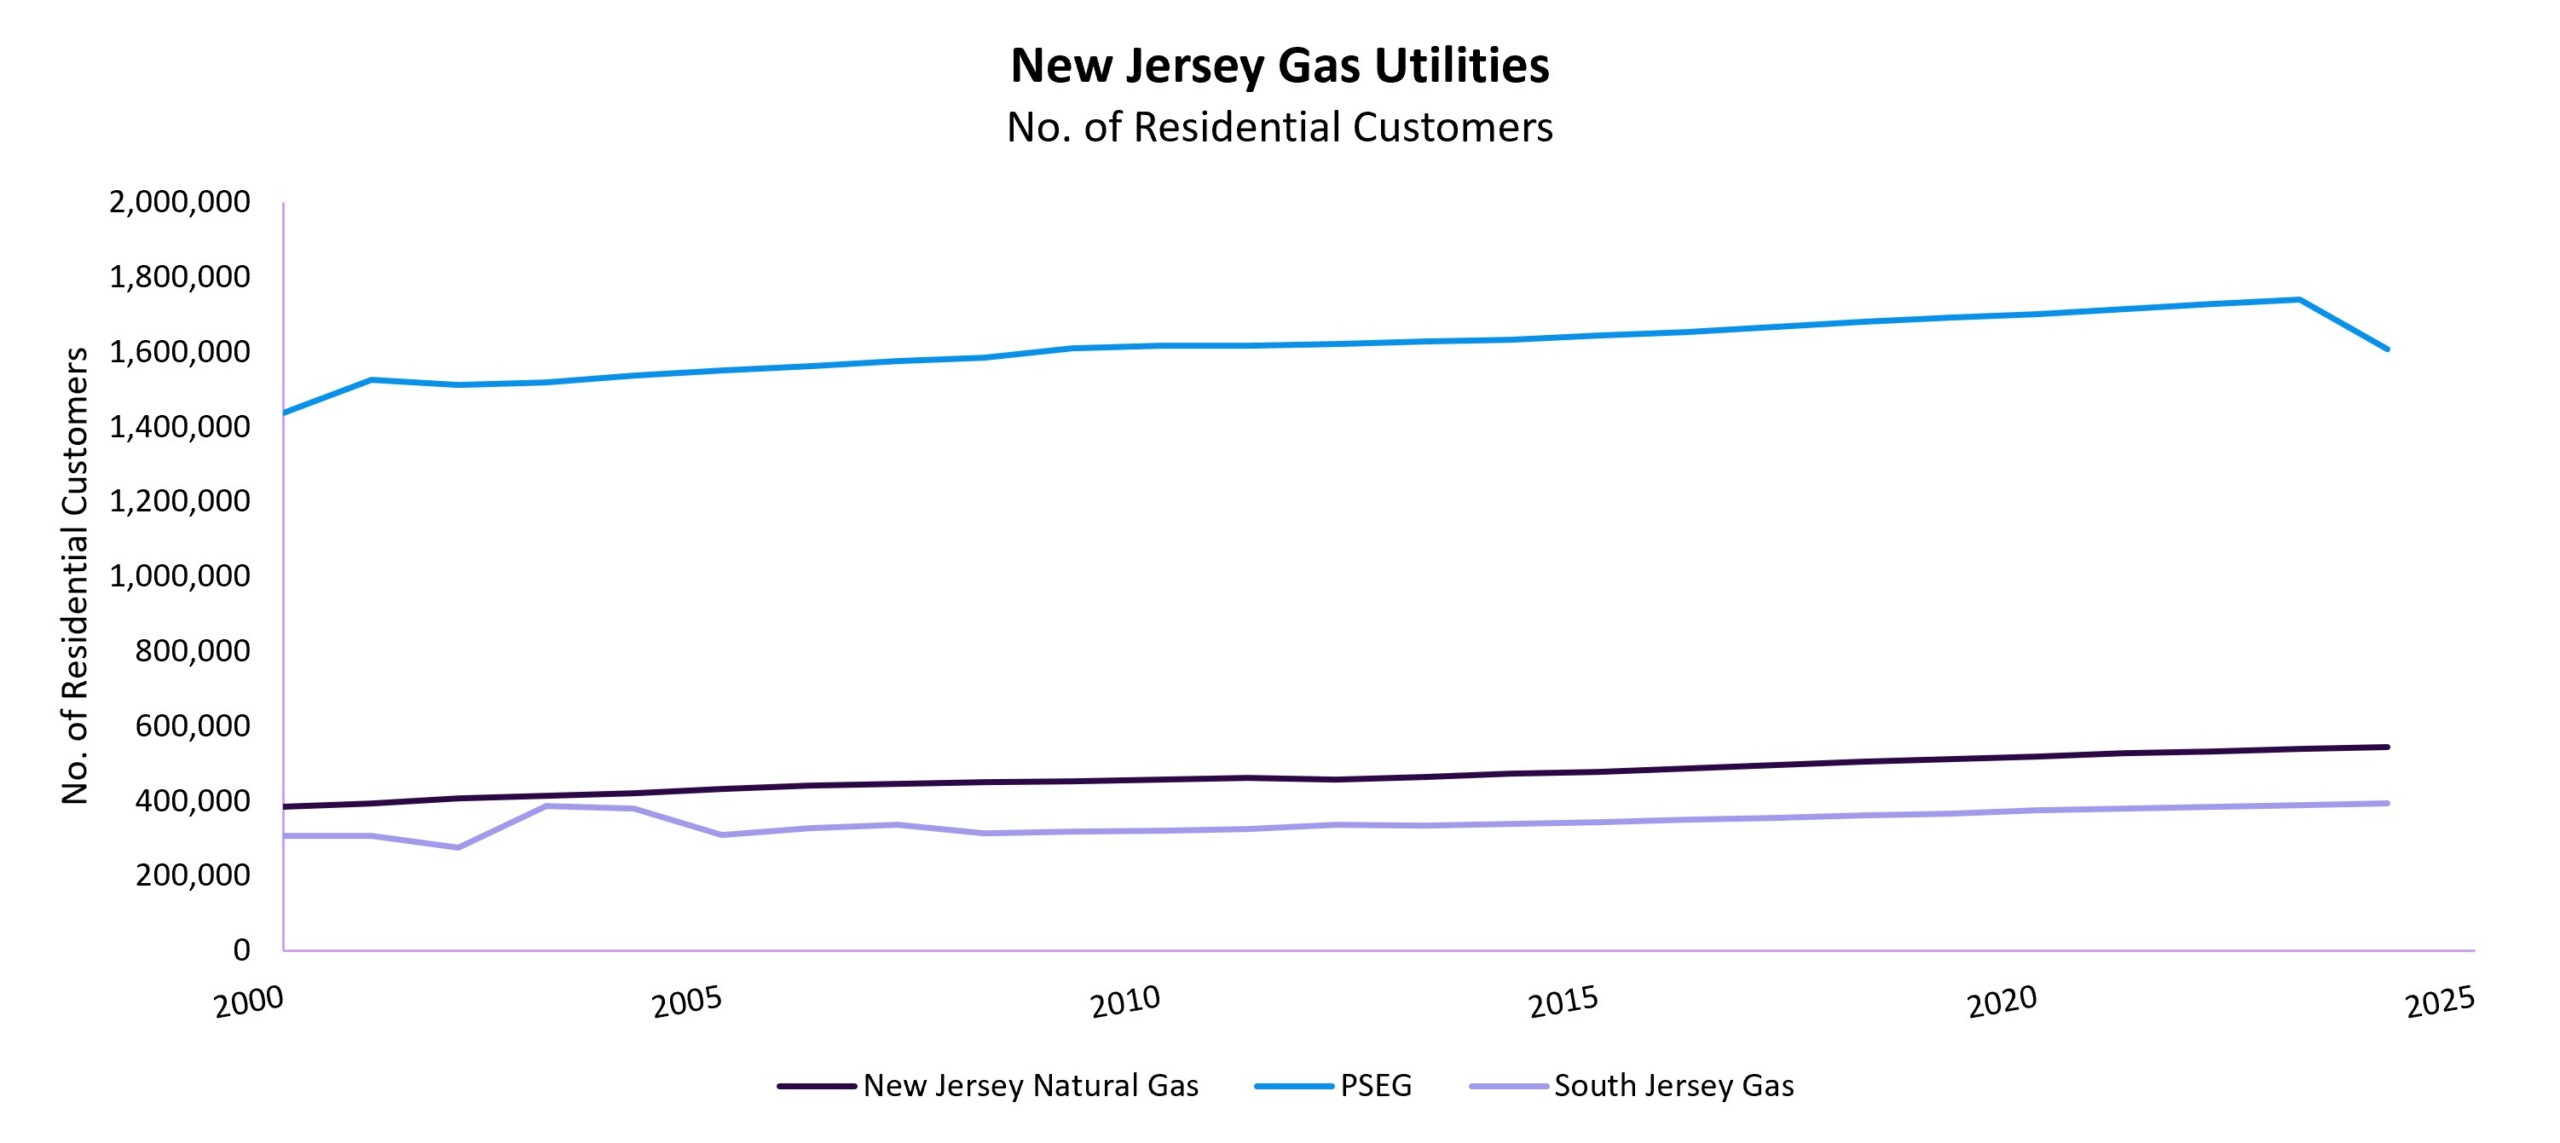
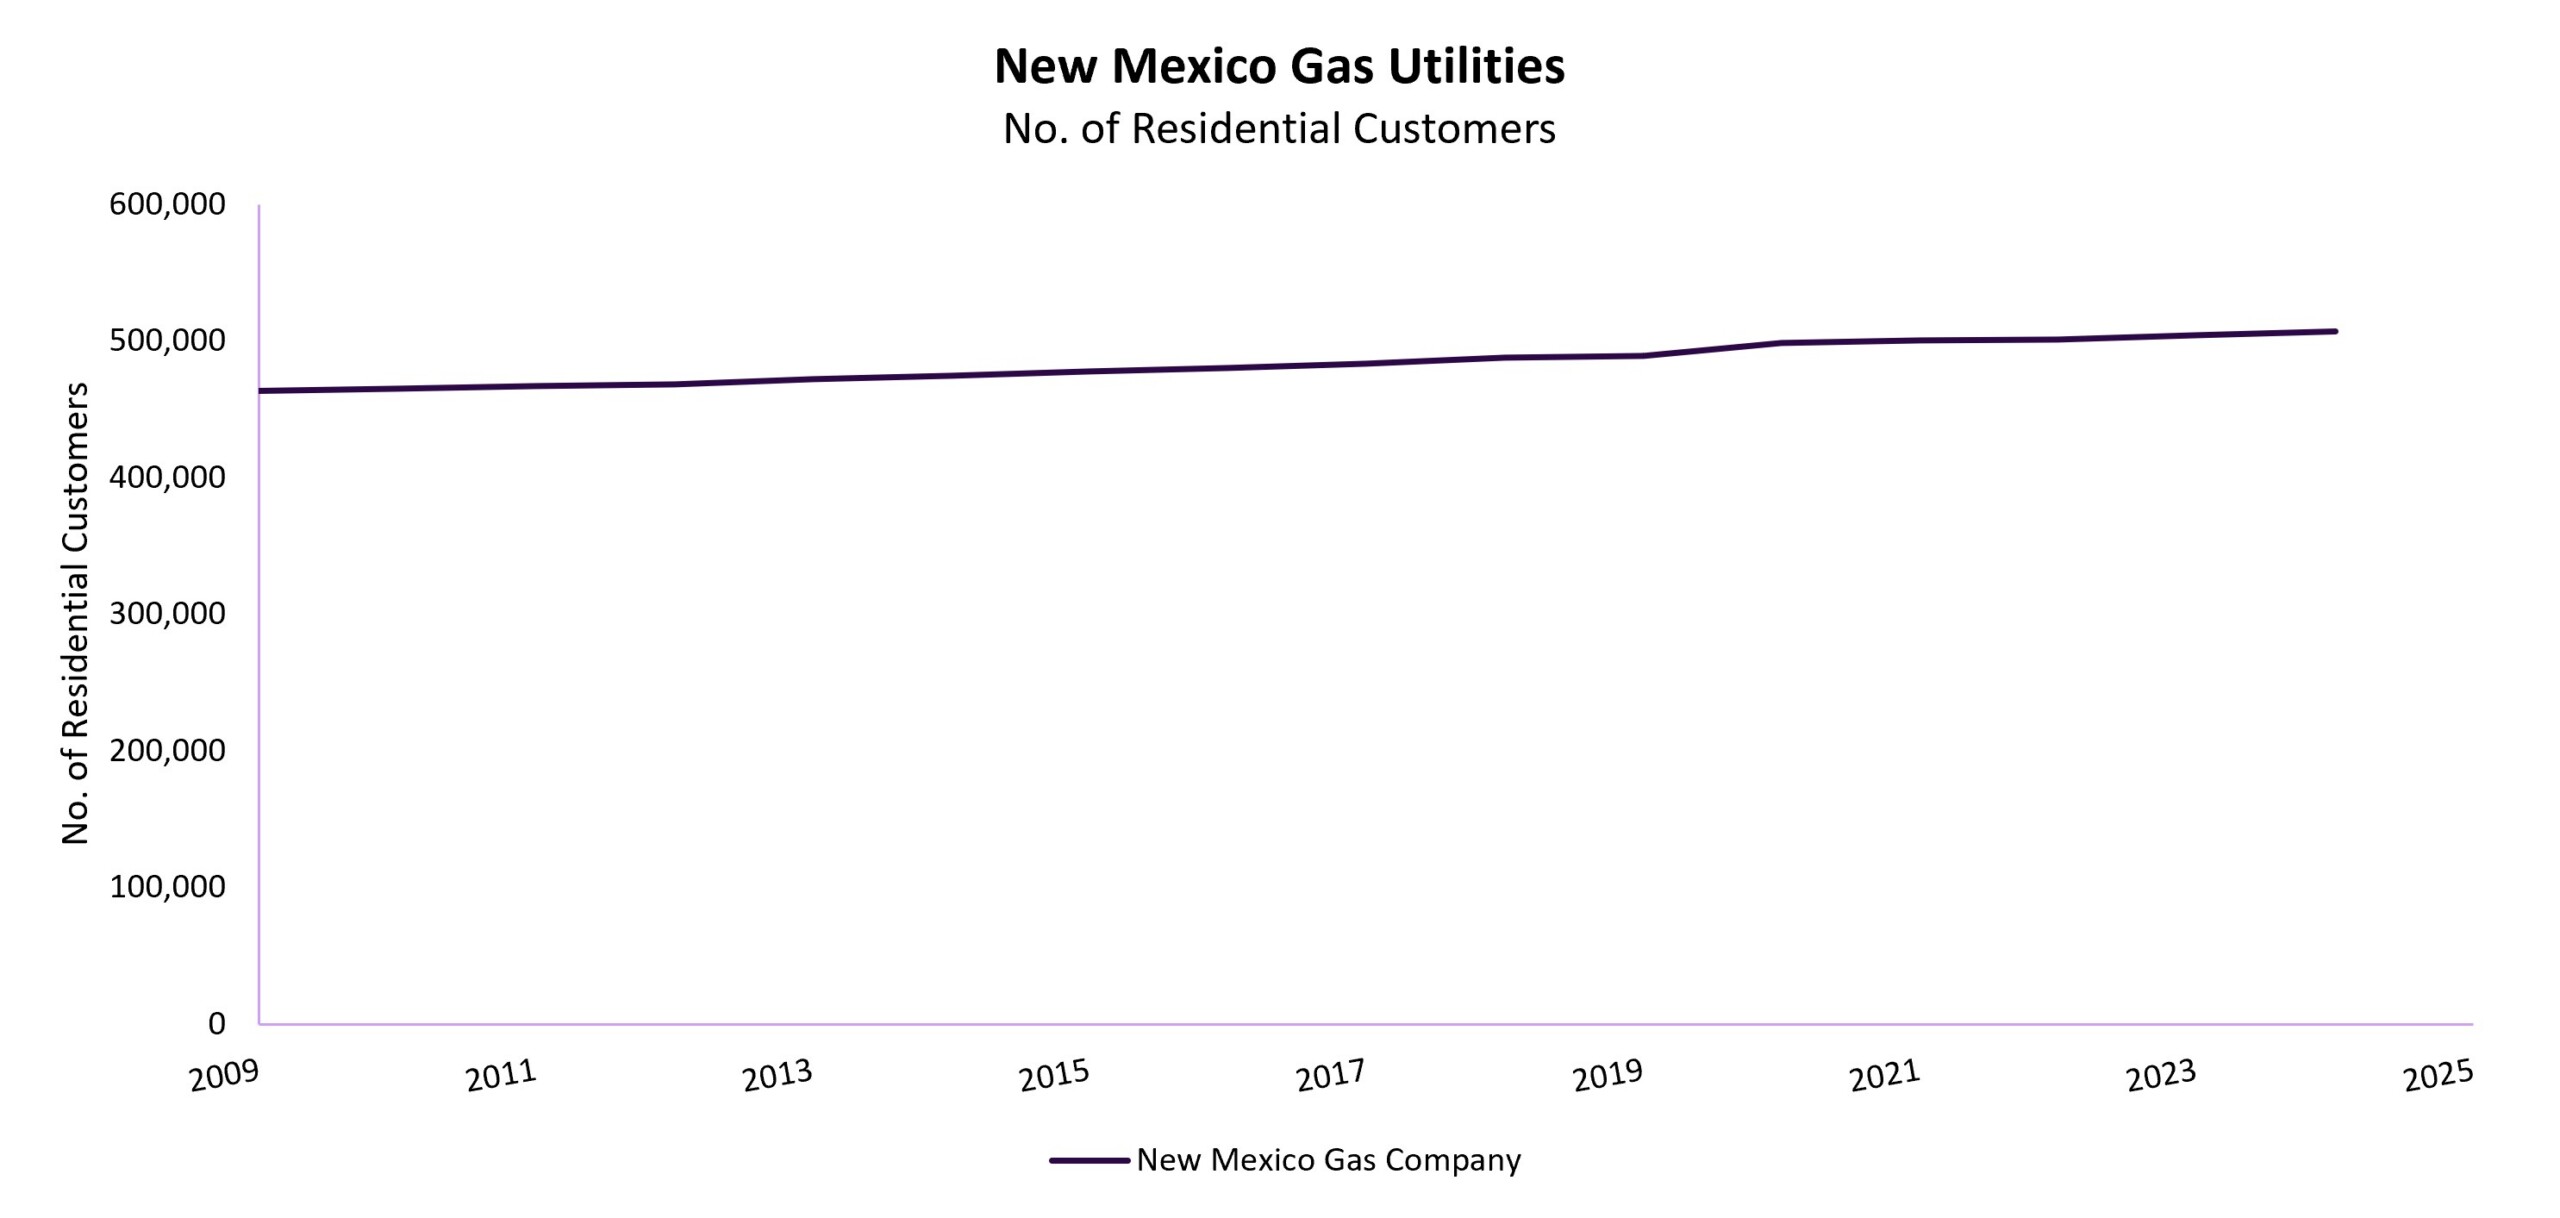
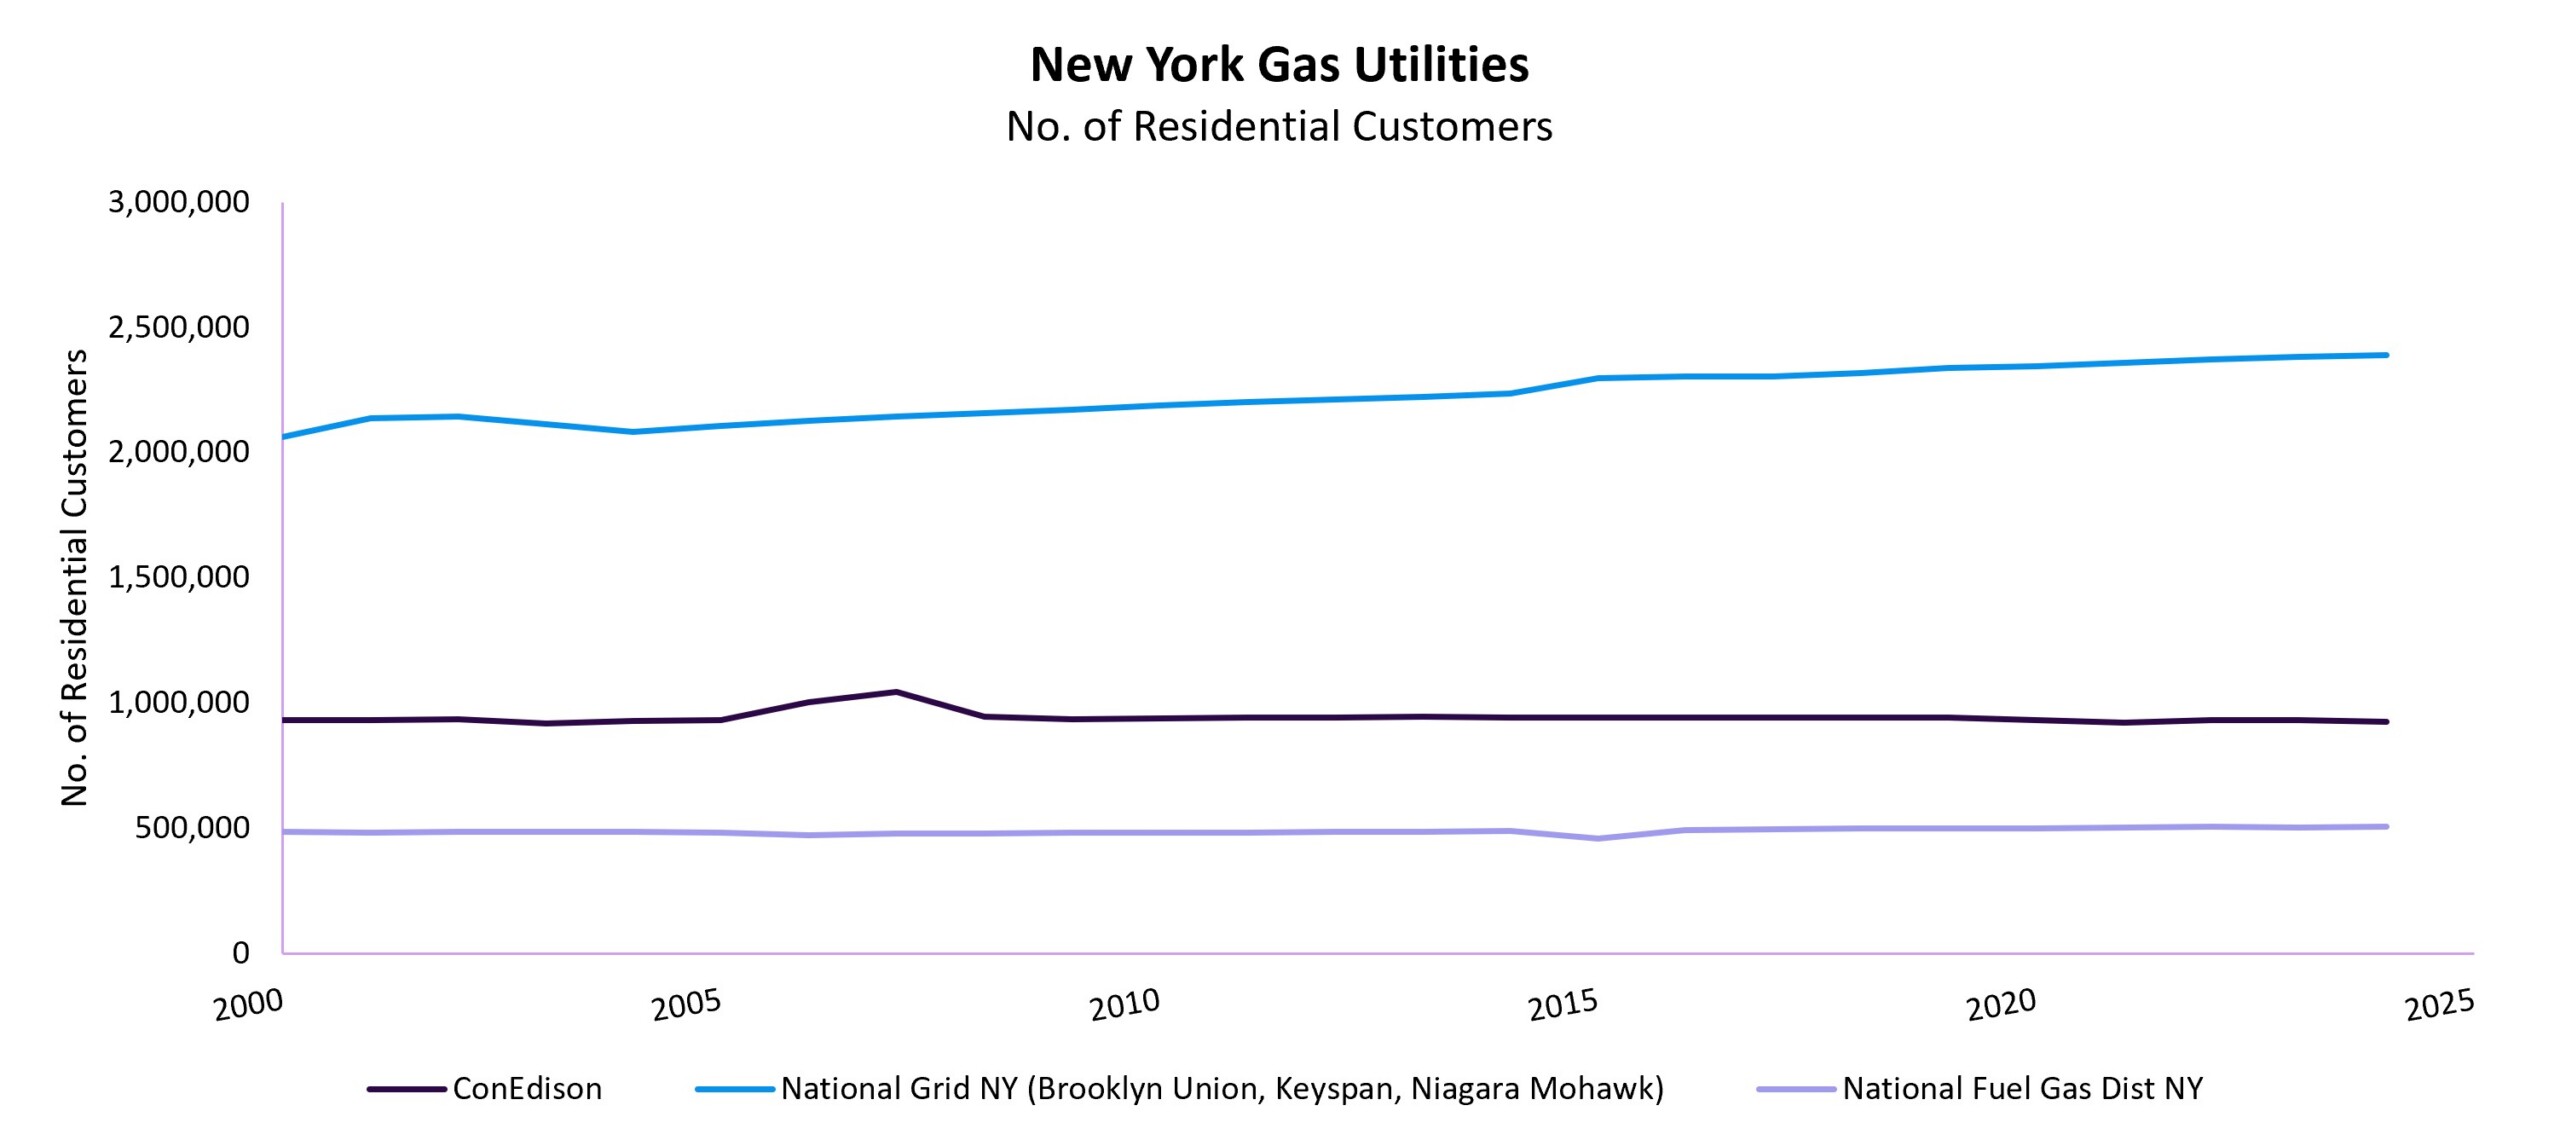
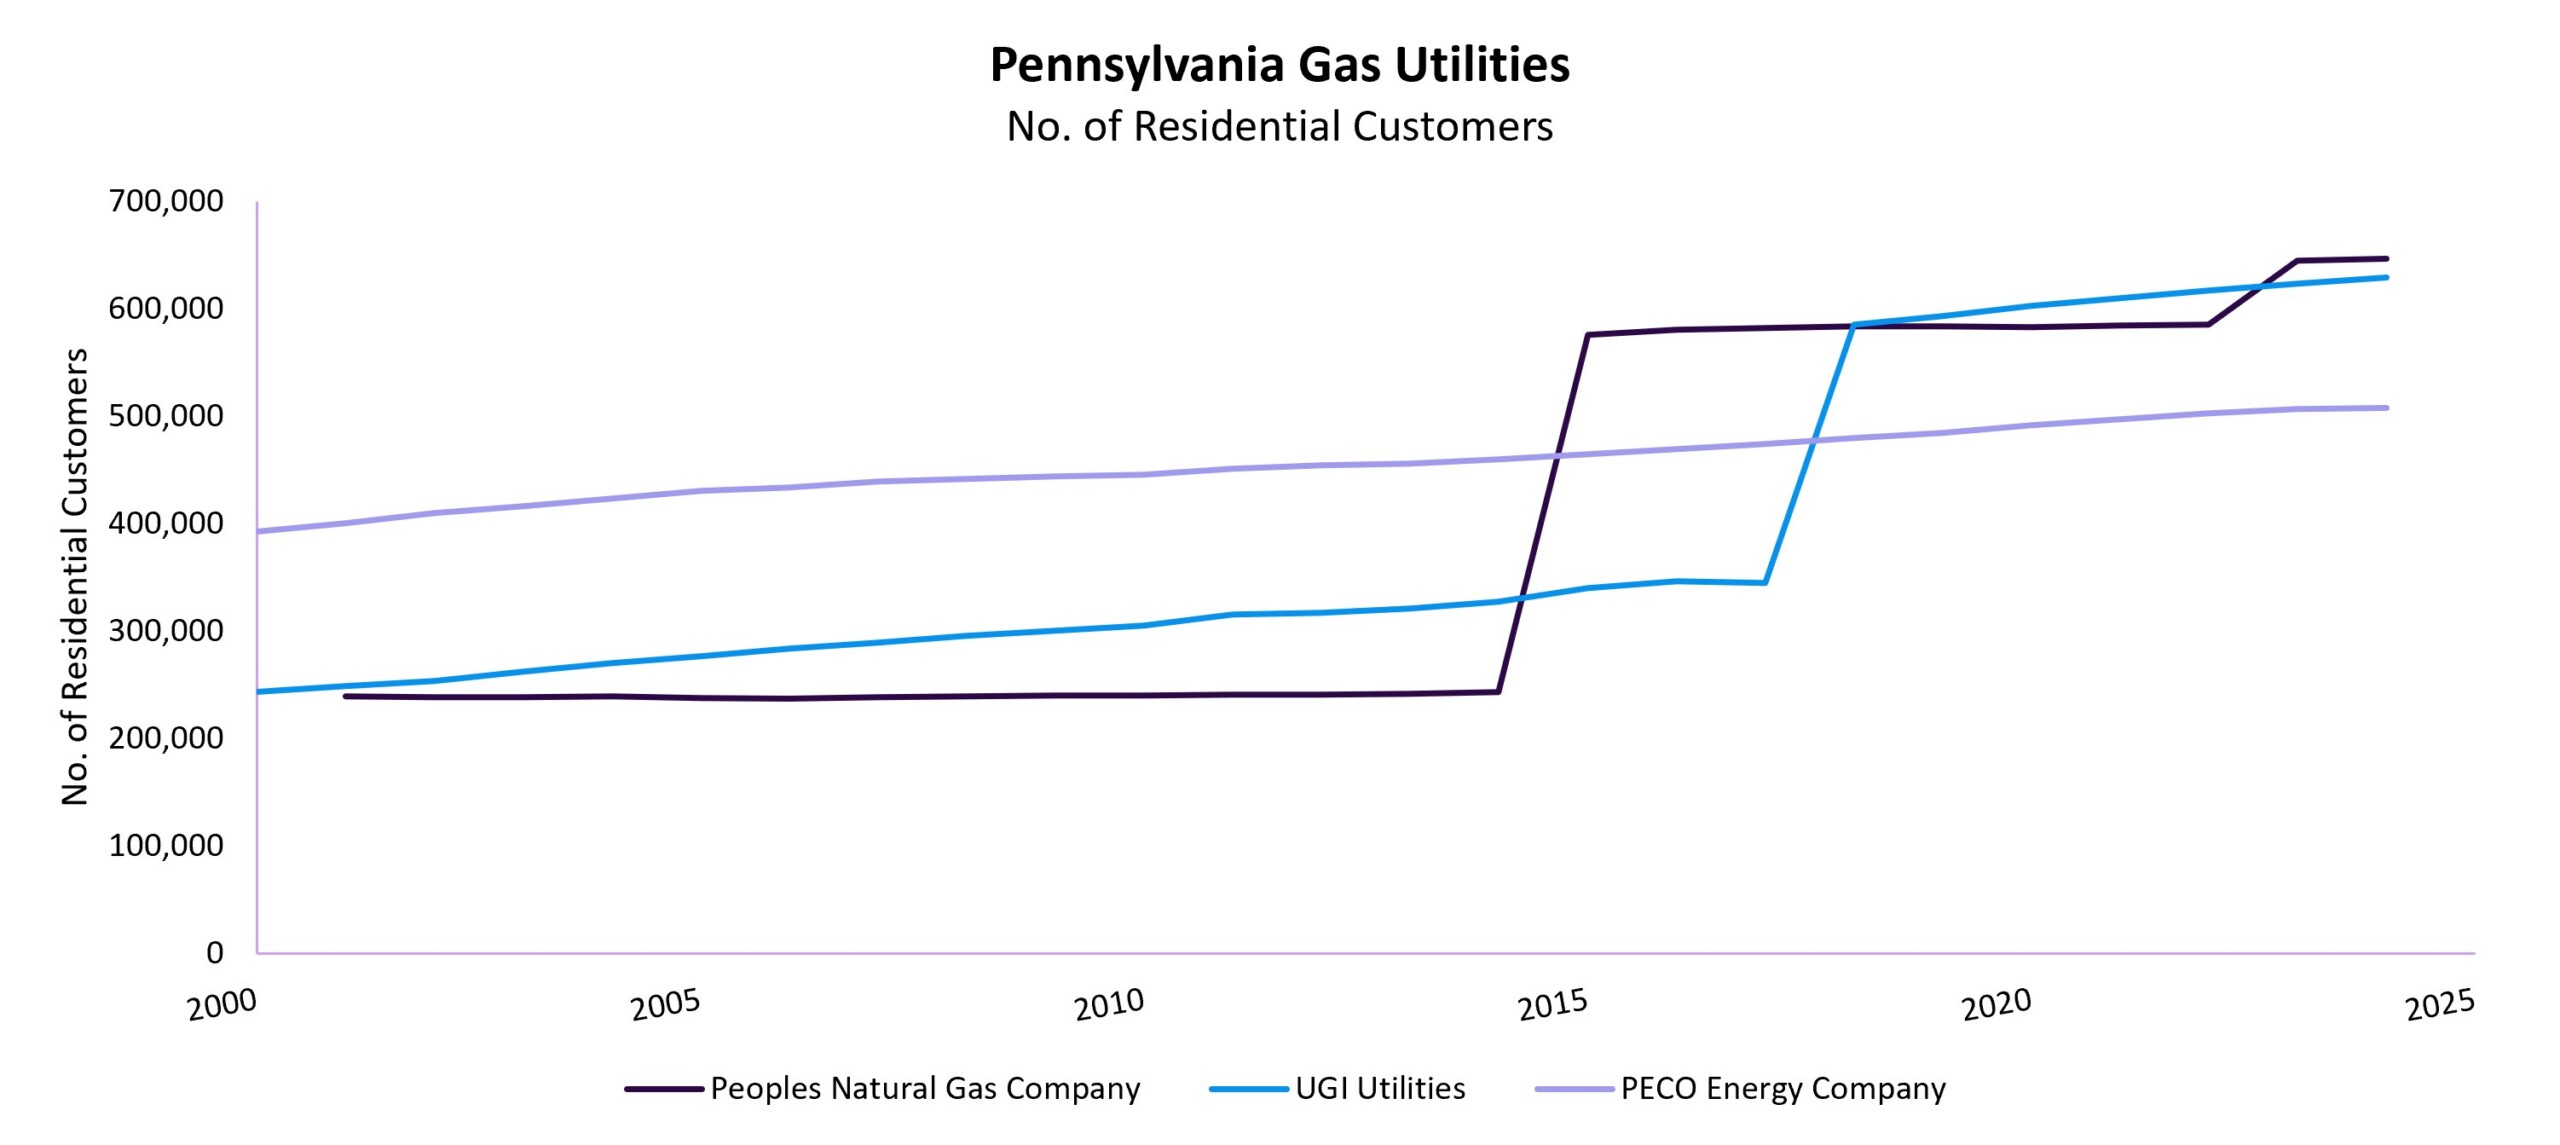
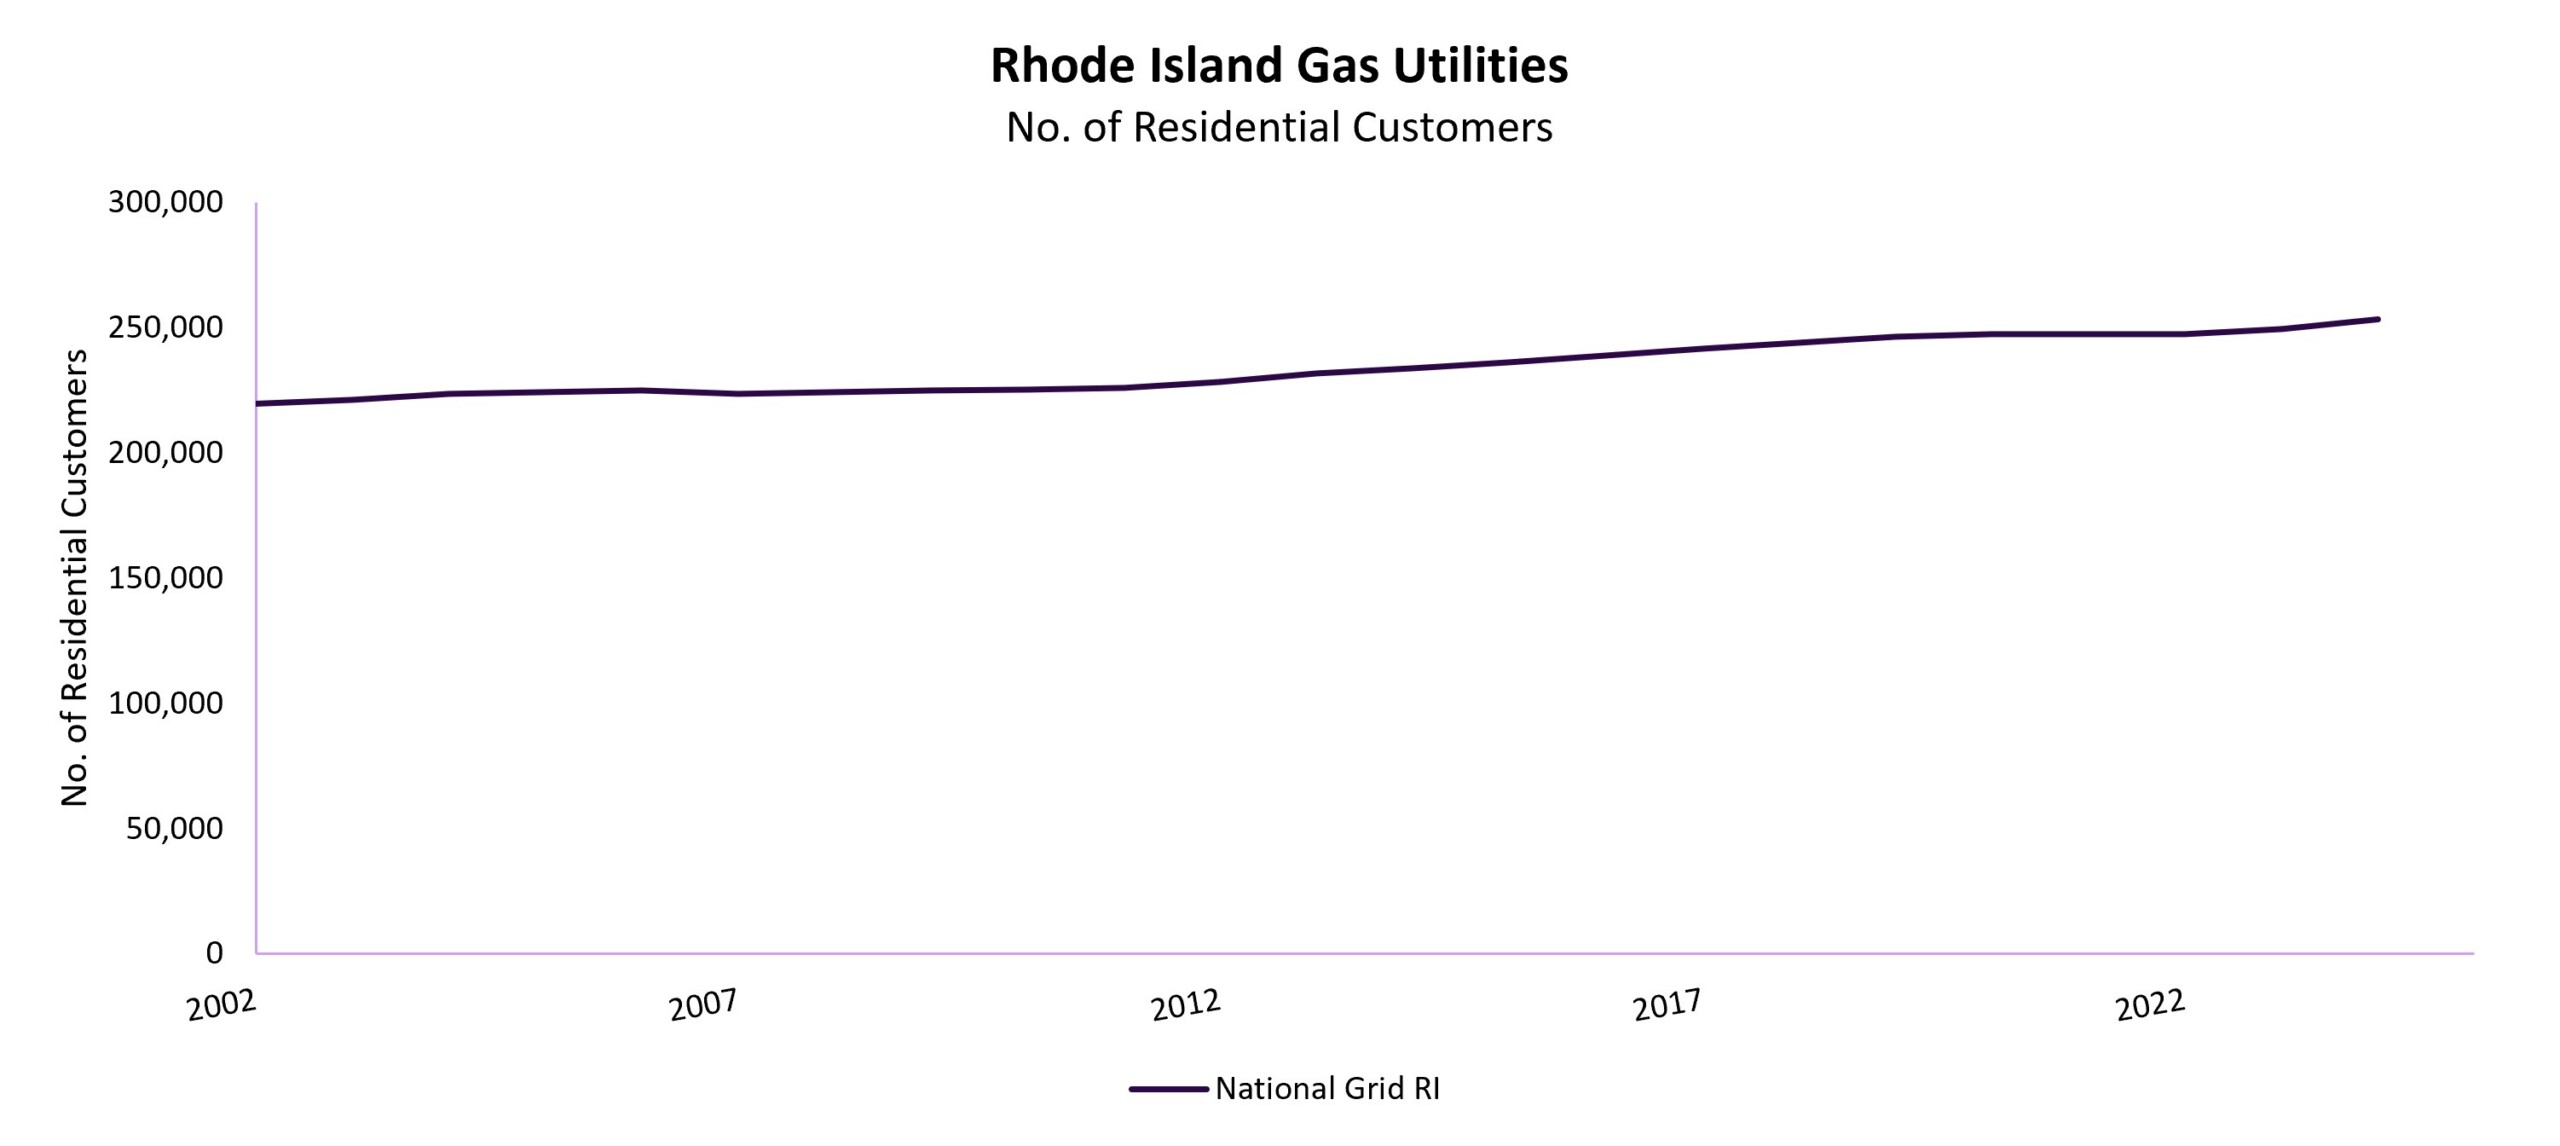
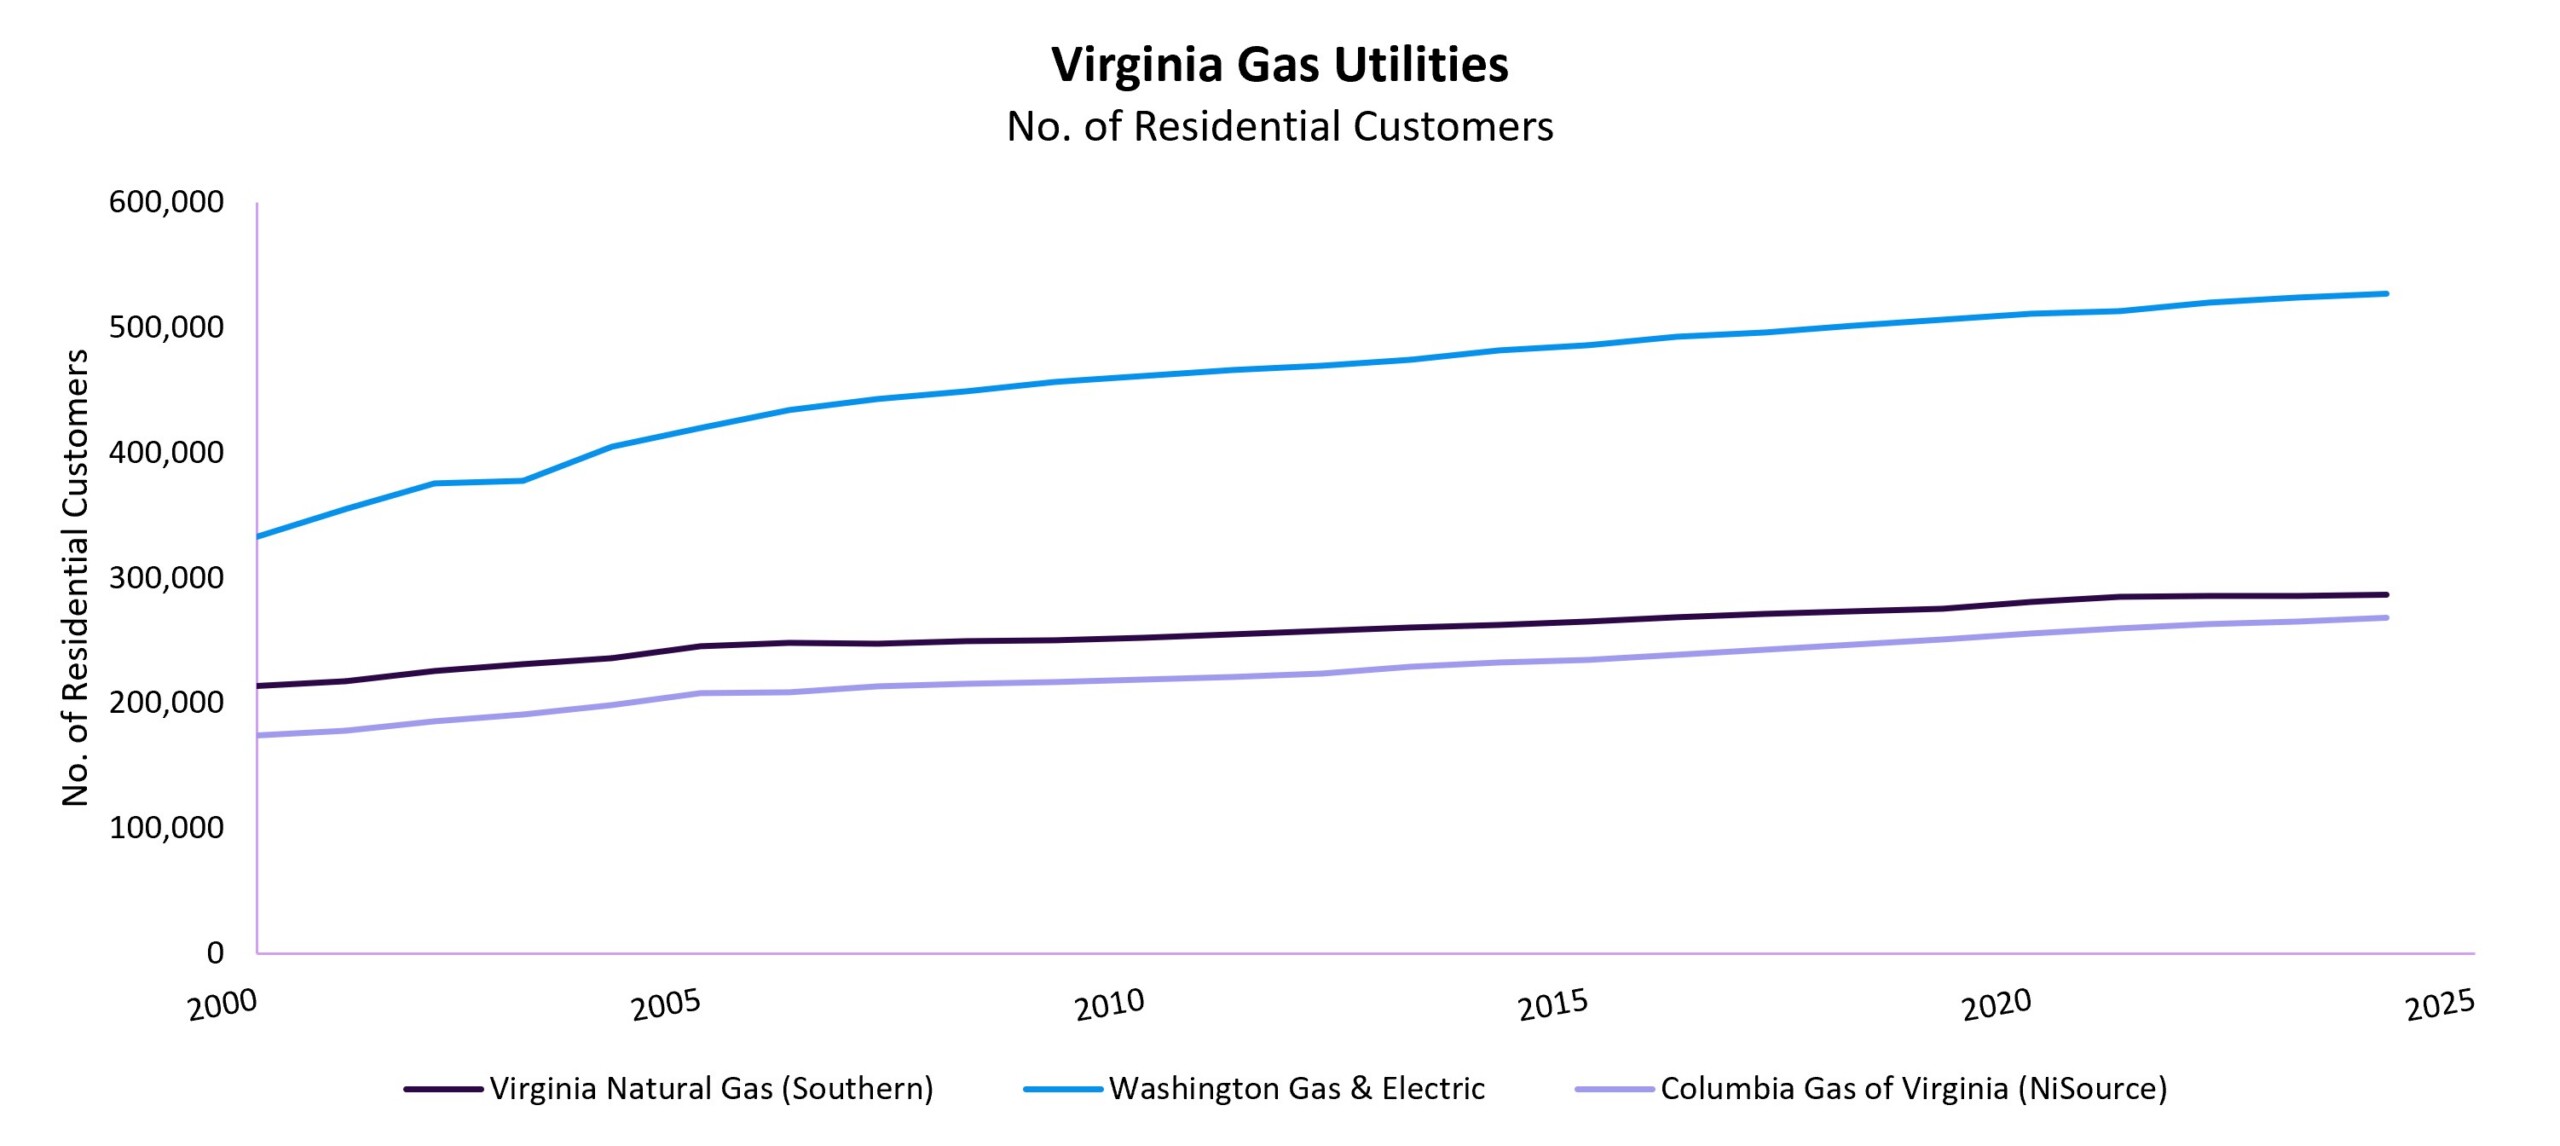
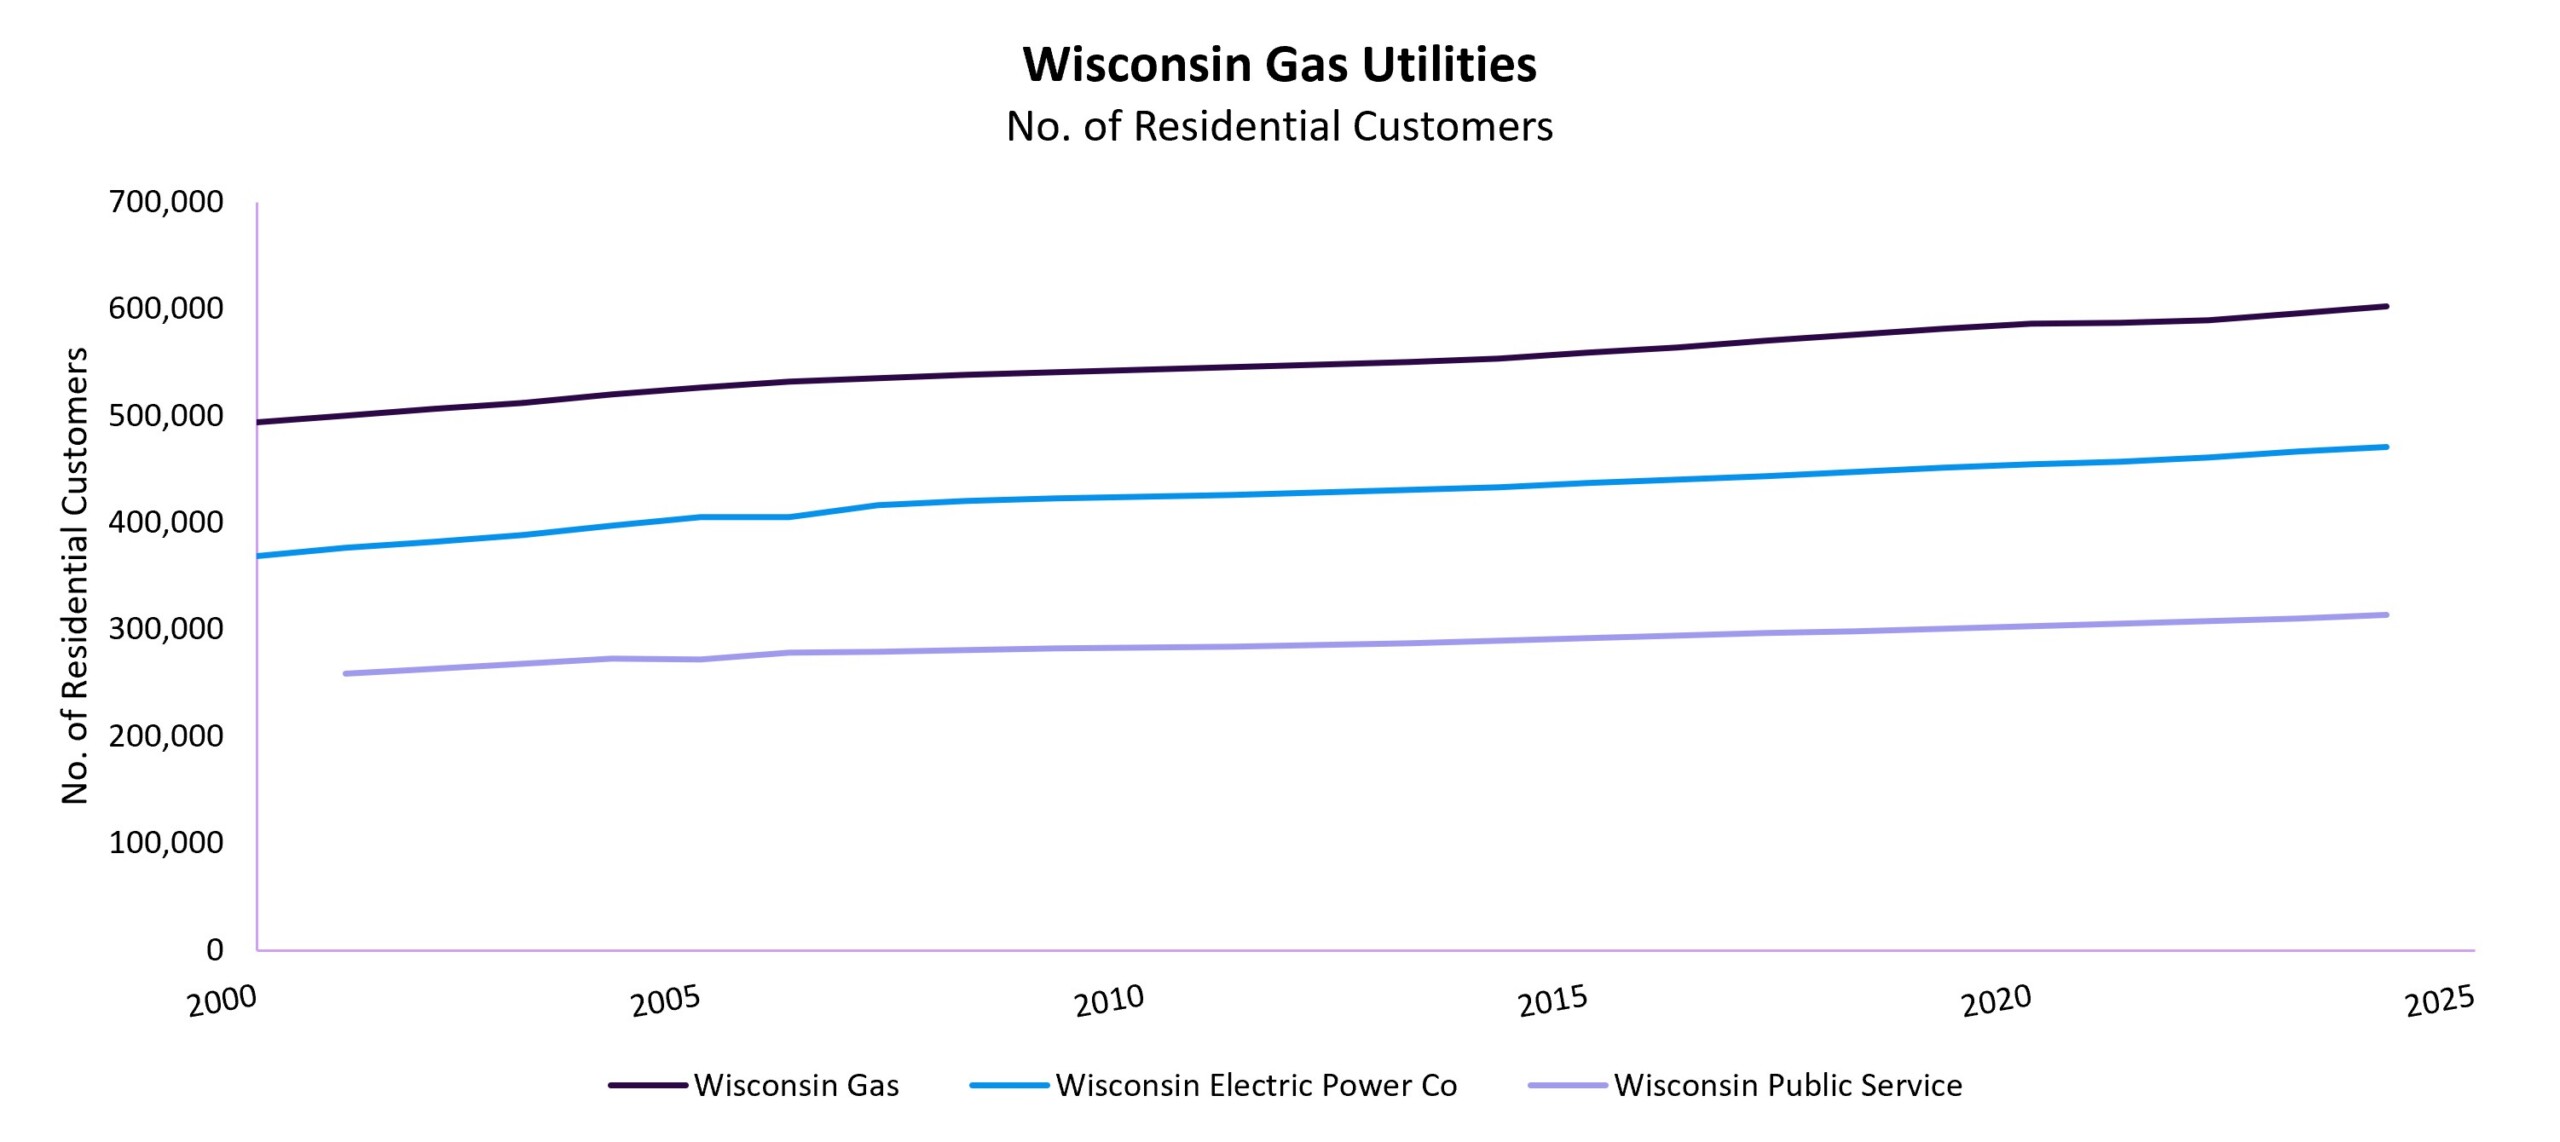
Only in a few utility service territories has the number of residential customers started to fall ever so slightly – these include Consolidated Edison in New York and Public Service Enterprise Group (PSEG) of New Jersey. Especially in the case of PSEG, we suspect that this may be a data anomaly; however, when EIA uploads its 2025 data, we will be able to confirm whether this is indicative of a more enduring trend. In most other places, the number of gas customers has increased.
Several utilities in the Northeast, Pacific Northwest, and Colorado have begun to forecast customer or sales declines in future years (e.g., Consolidated Edison’s 2023 Long Term Gas System Plan, Puget Sound Energy’s 2024 rate case, Xcel Colorado’s 2025-2030 Gas Infrastructure Plan, PG&E’s 2026 California Gas Report) given the growth in market-based electrification and policies driving towards cleaner heat. Utility filings and future EIA data can be used to confirm those forecasts. A decline in residential customer count may signify population changes (net migration out of the state), or increasing numbers of whole-home electrification projects wherein the customer disconnects entirely from the gas system. Most states are not keeping track – or not publishing – data on the number of voluntary disconnections at present, but may reasonably begin to do so in the next several years. As electrification-related disconnections accelerate, fixed system costs will be shifted onto remaining customers, and we can expect to see system costs rise even further.
Residential Gas Sales per Customer
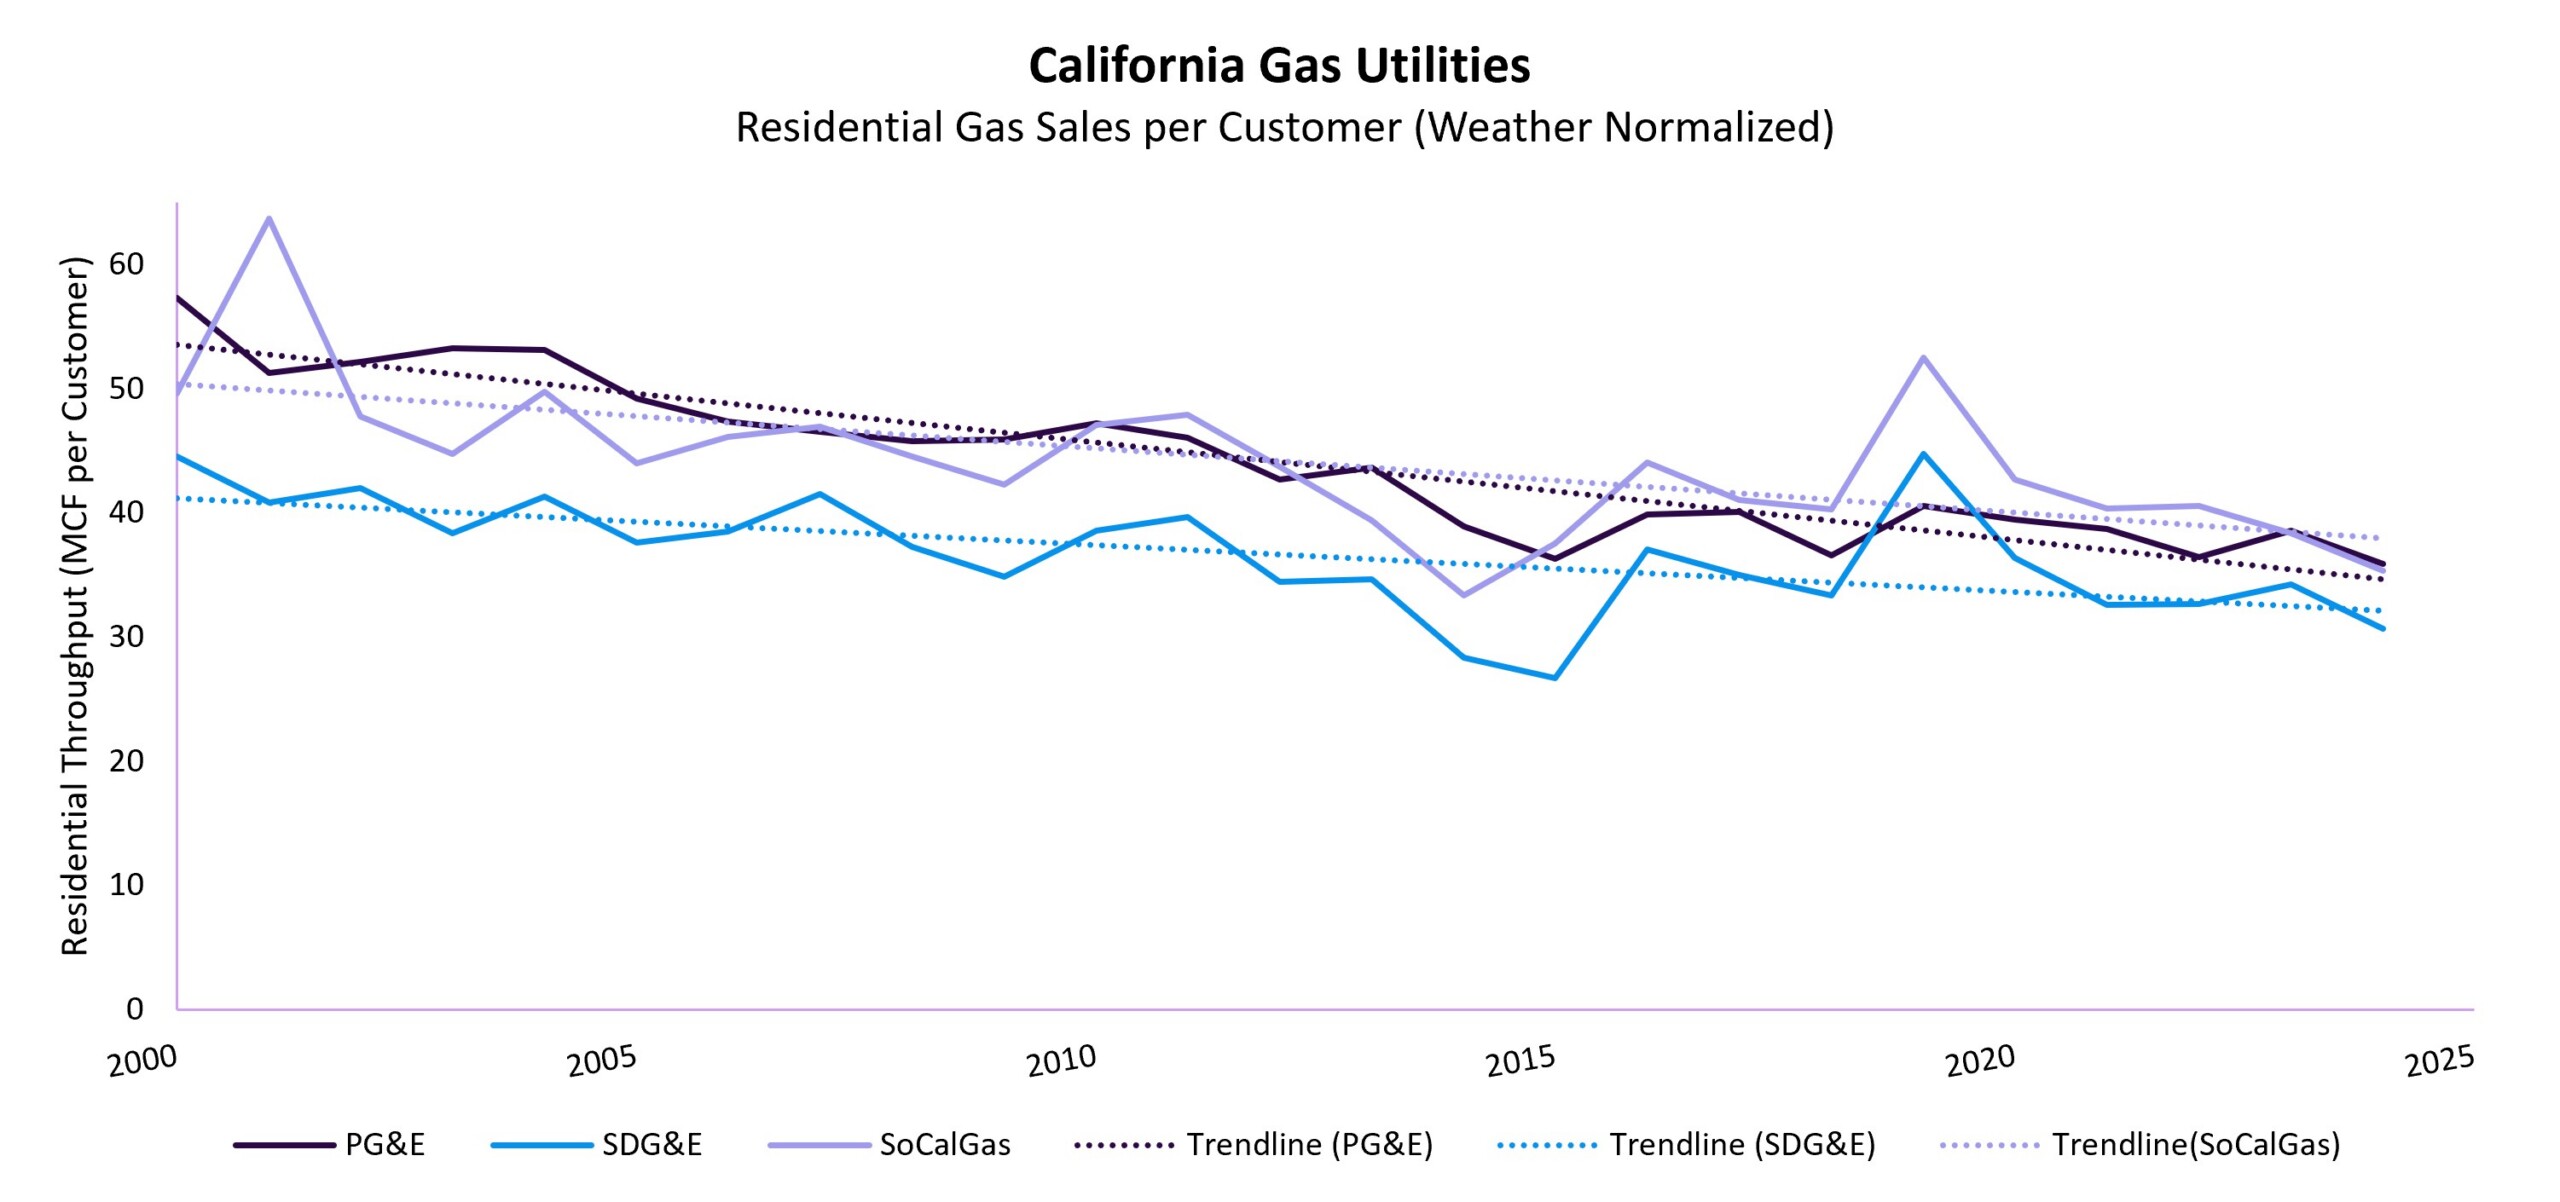
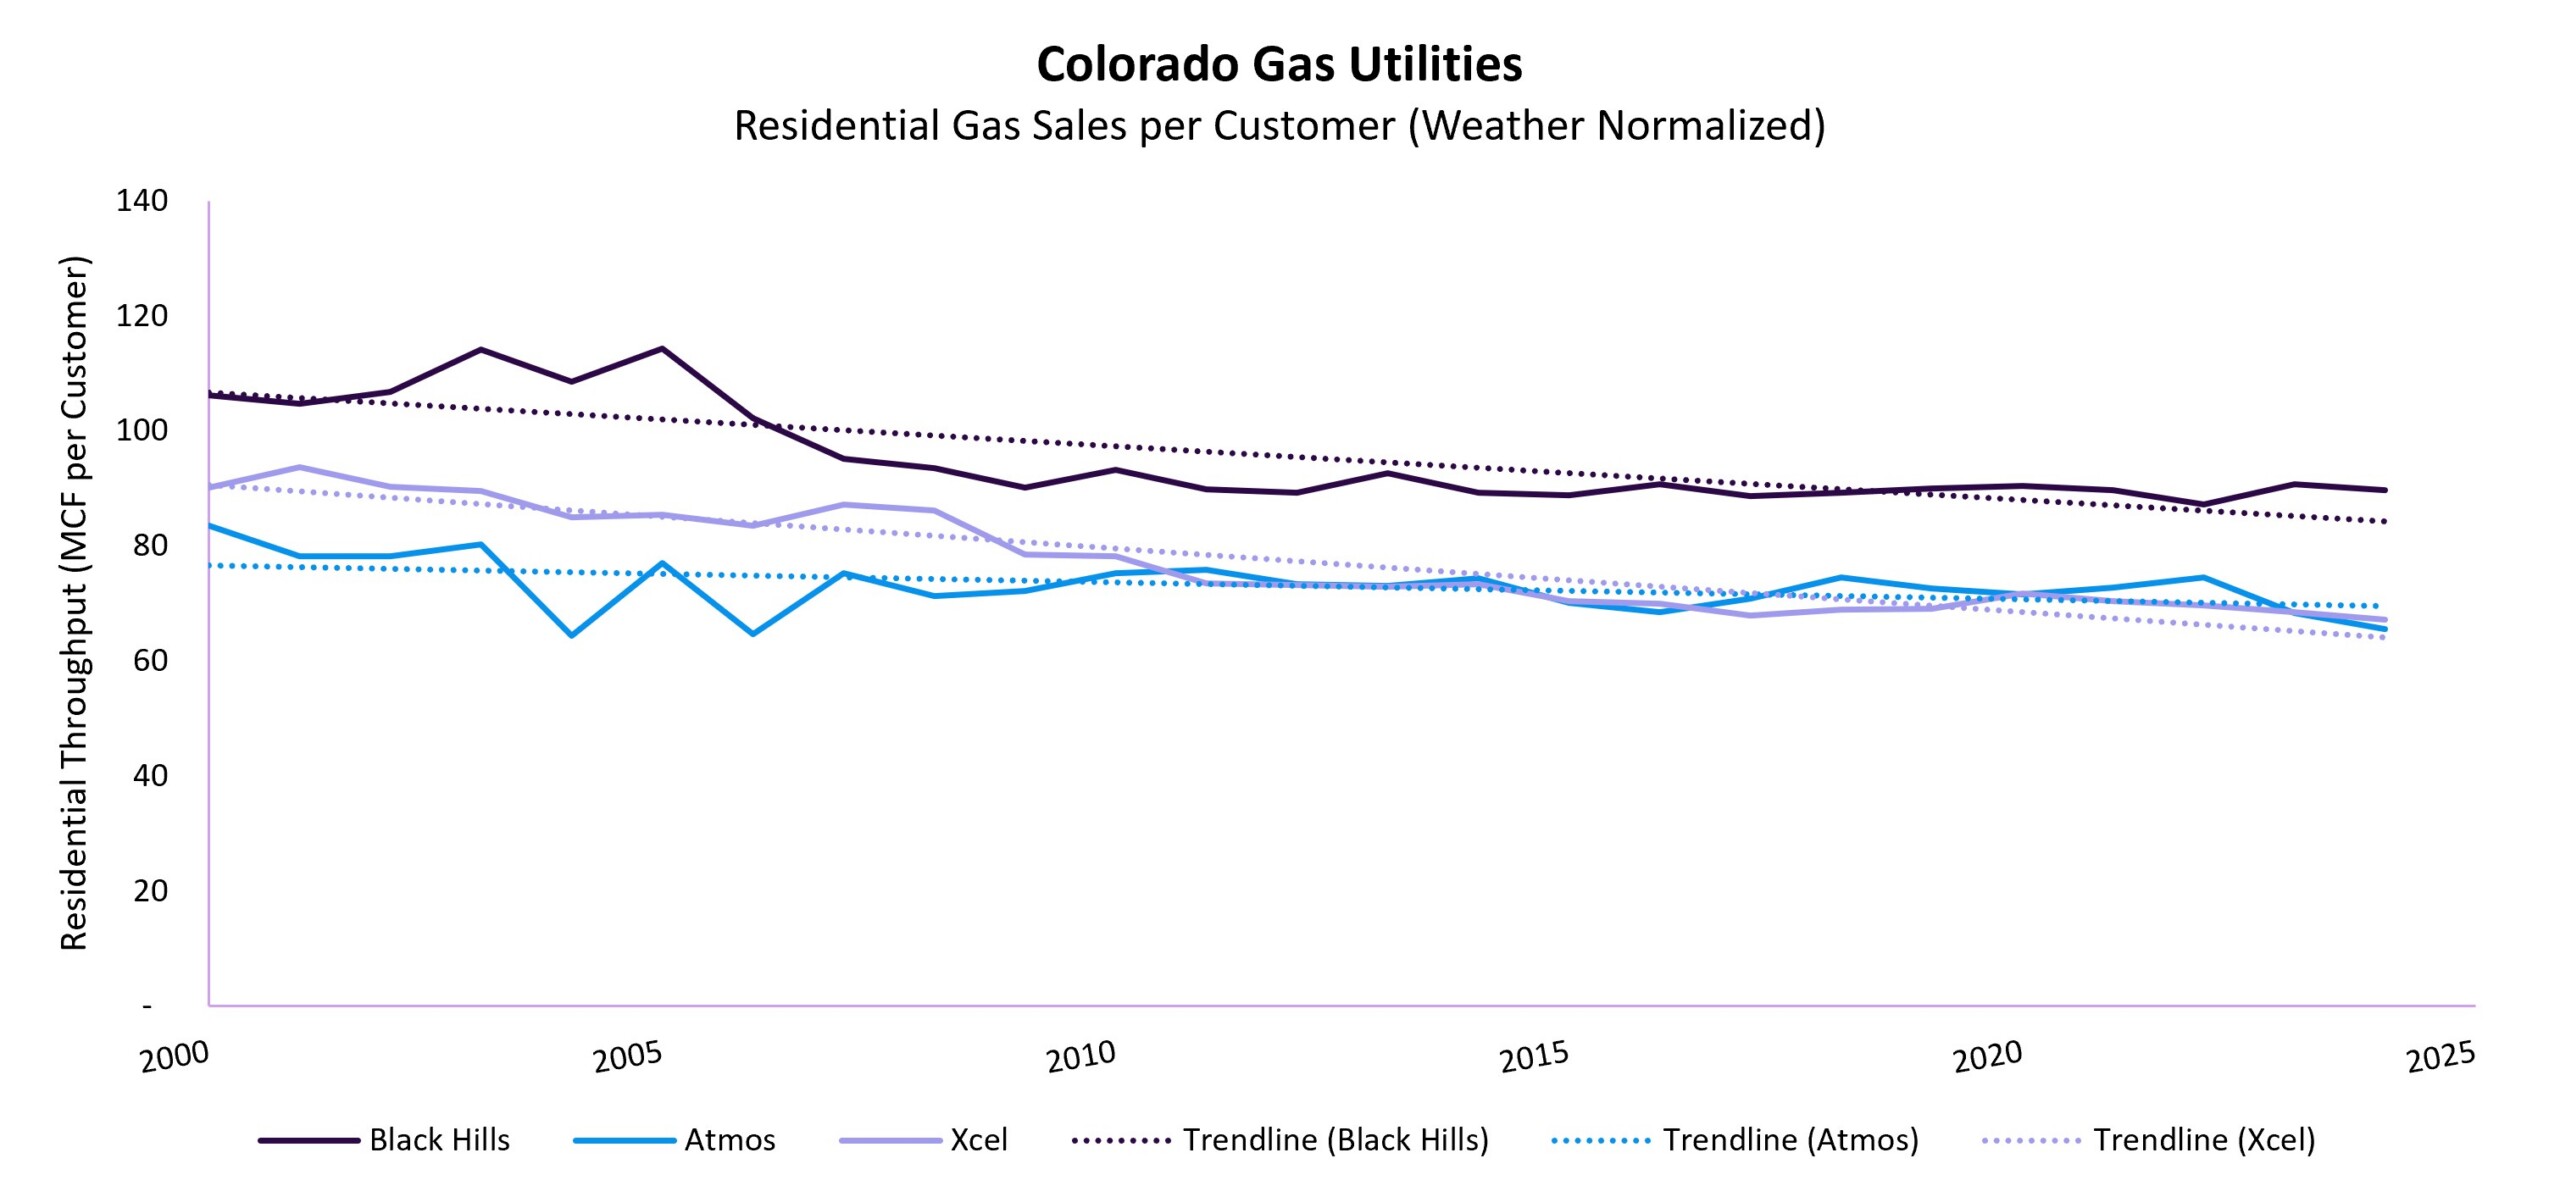
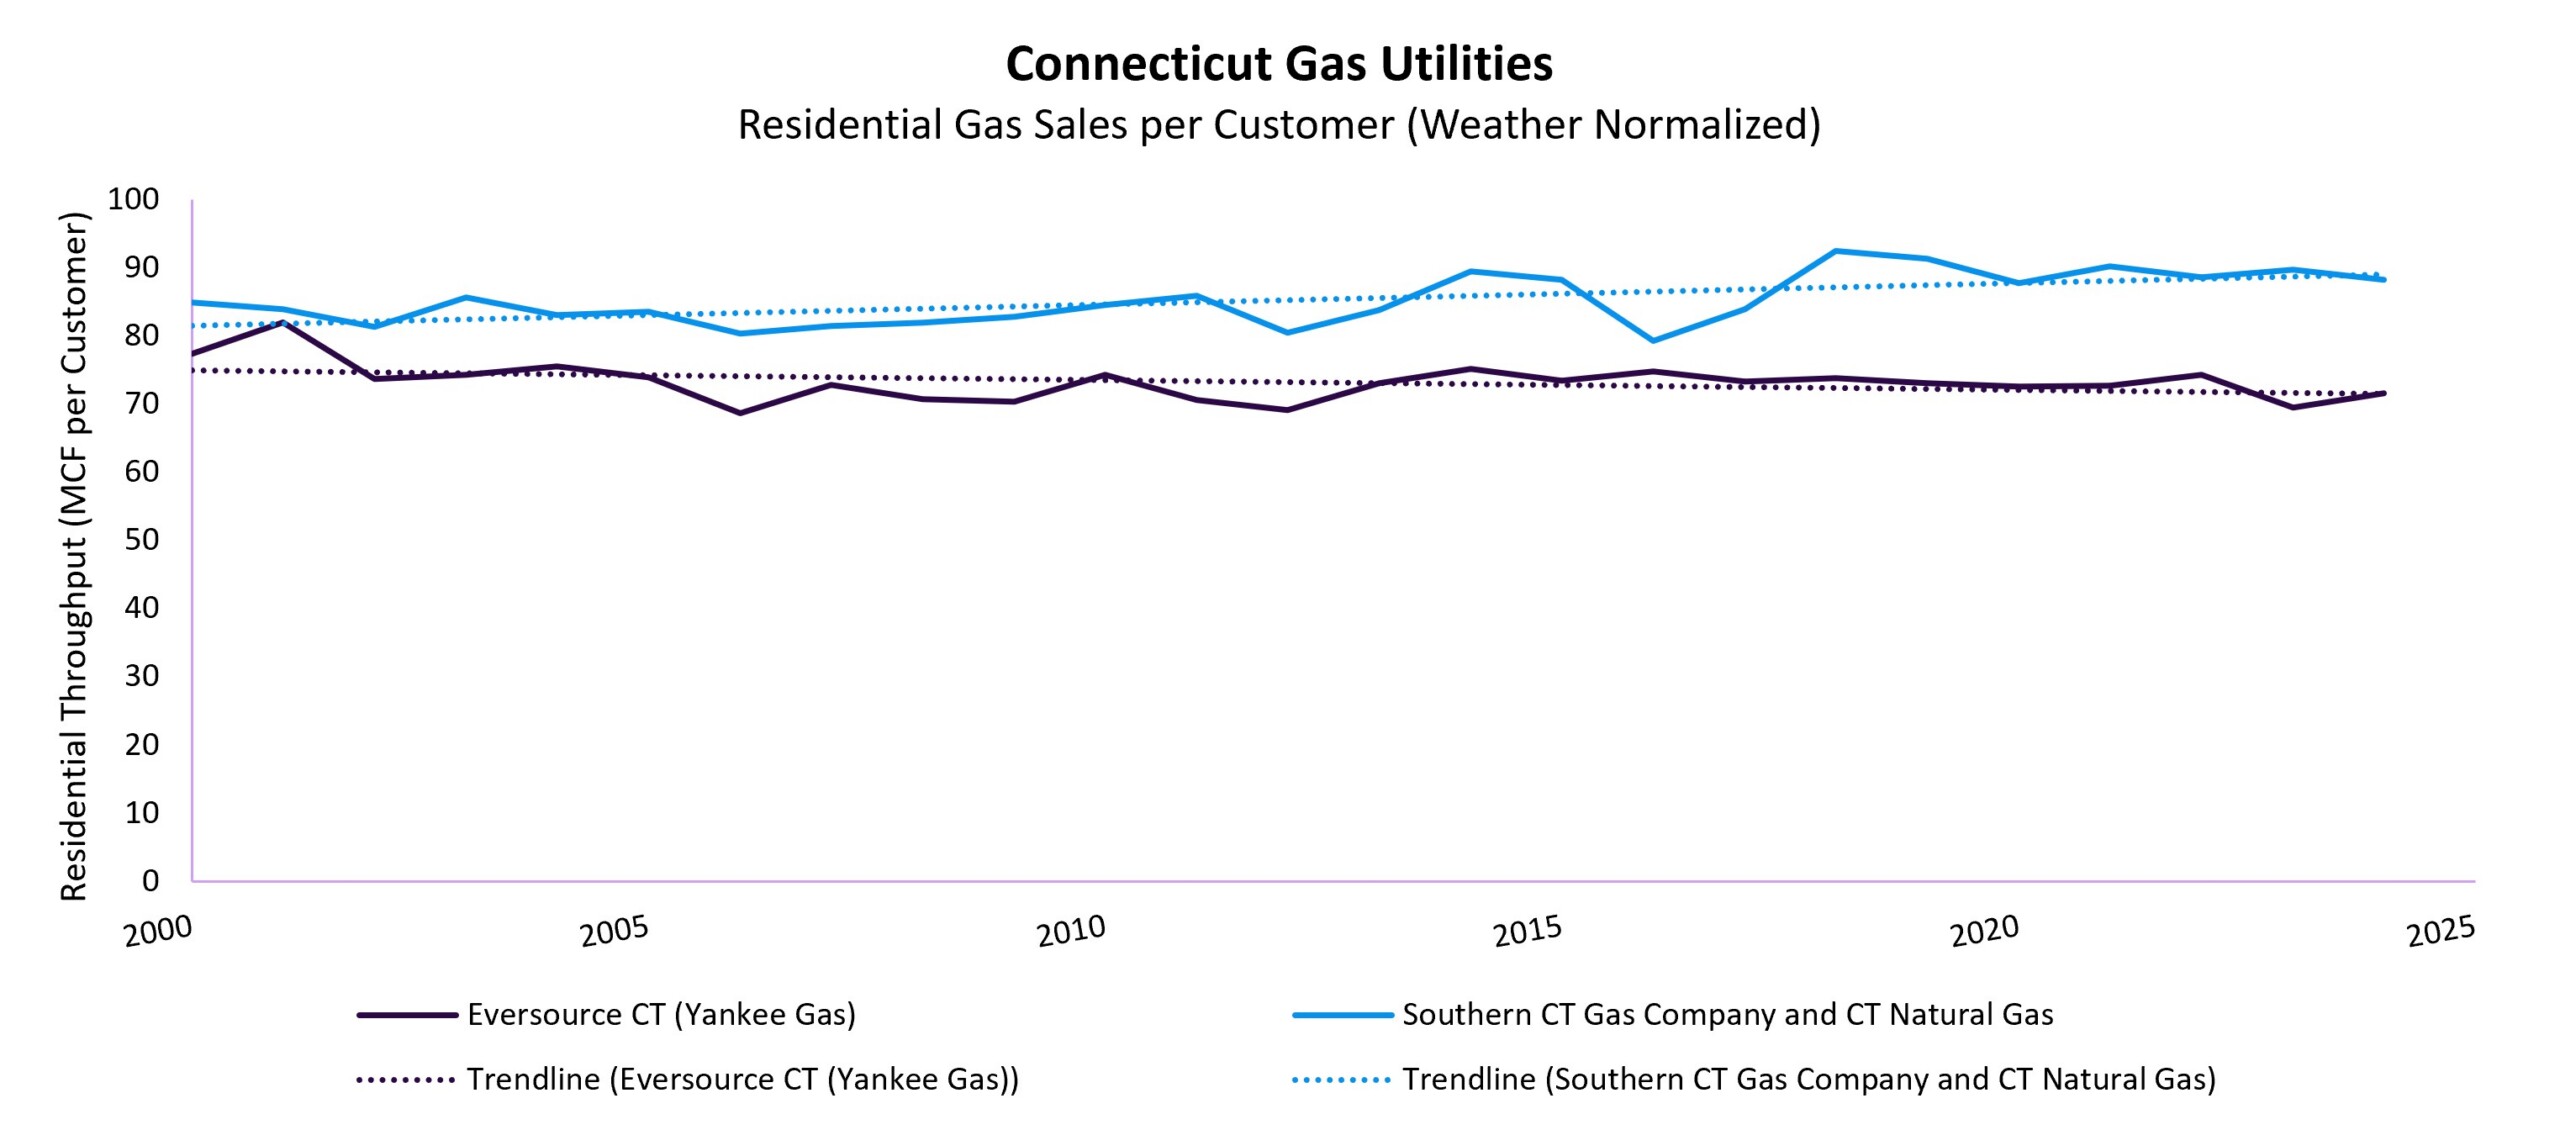
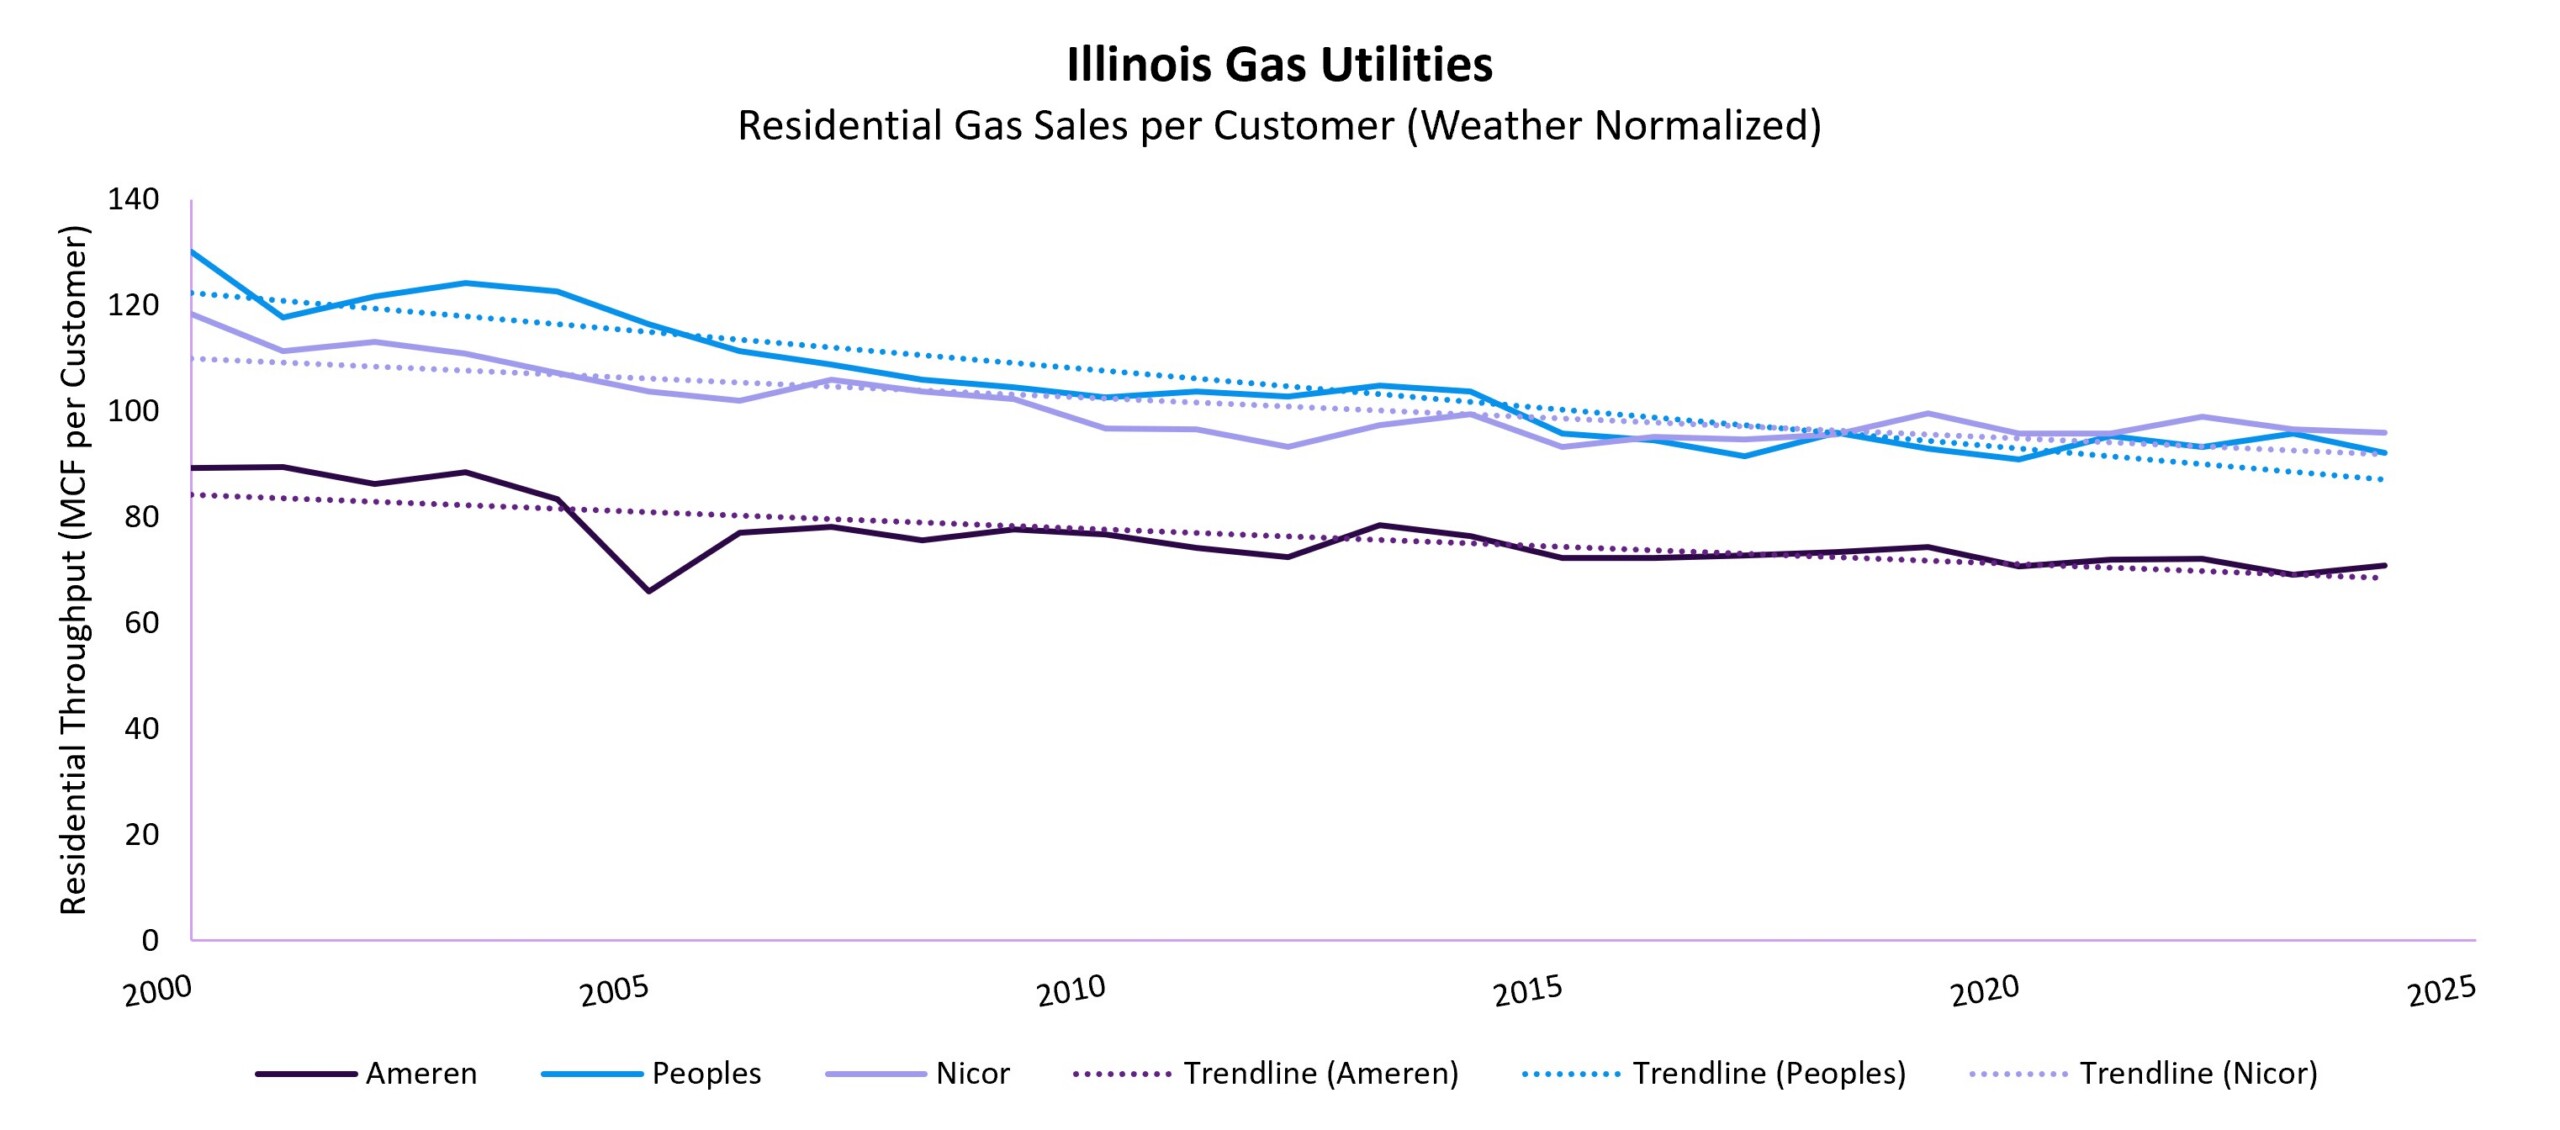
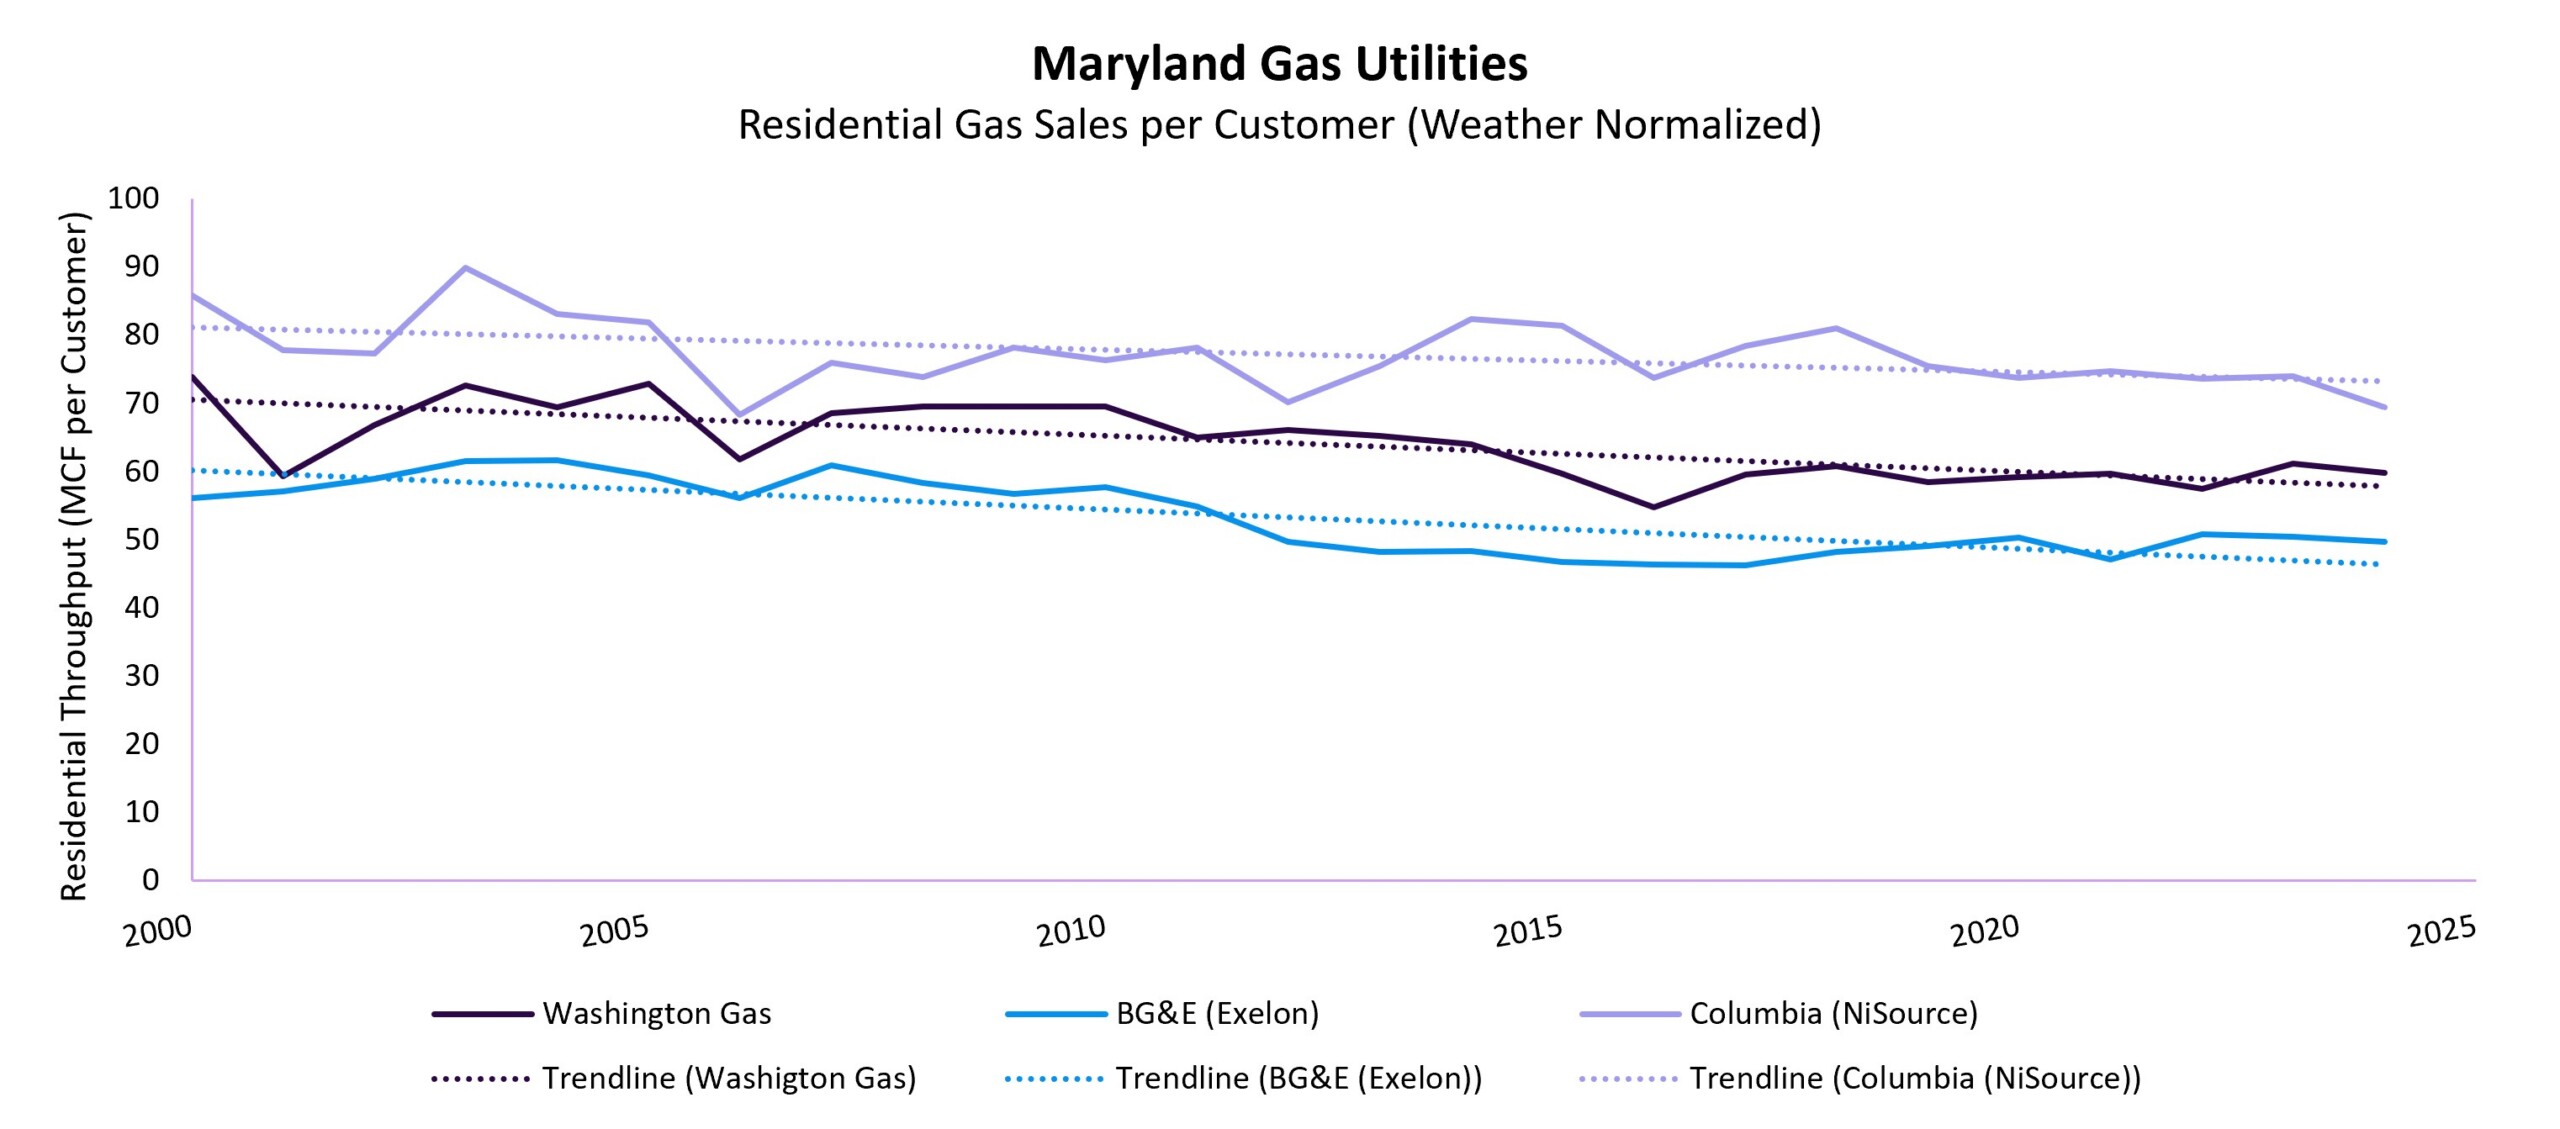
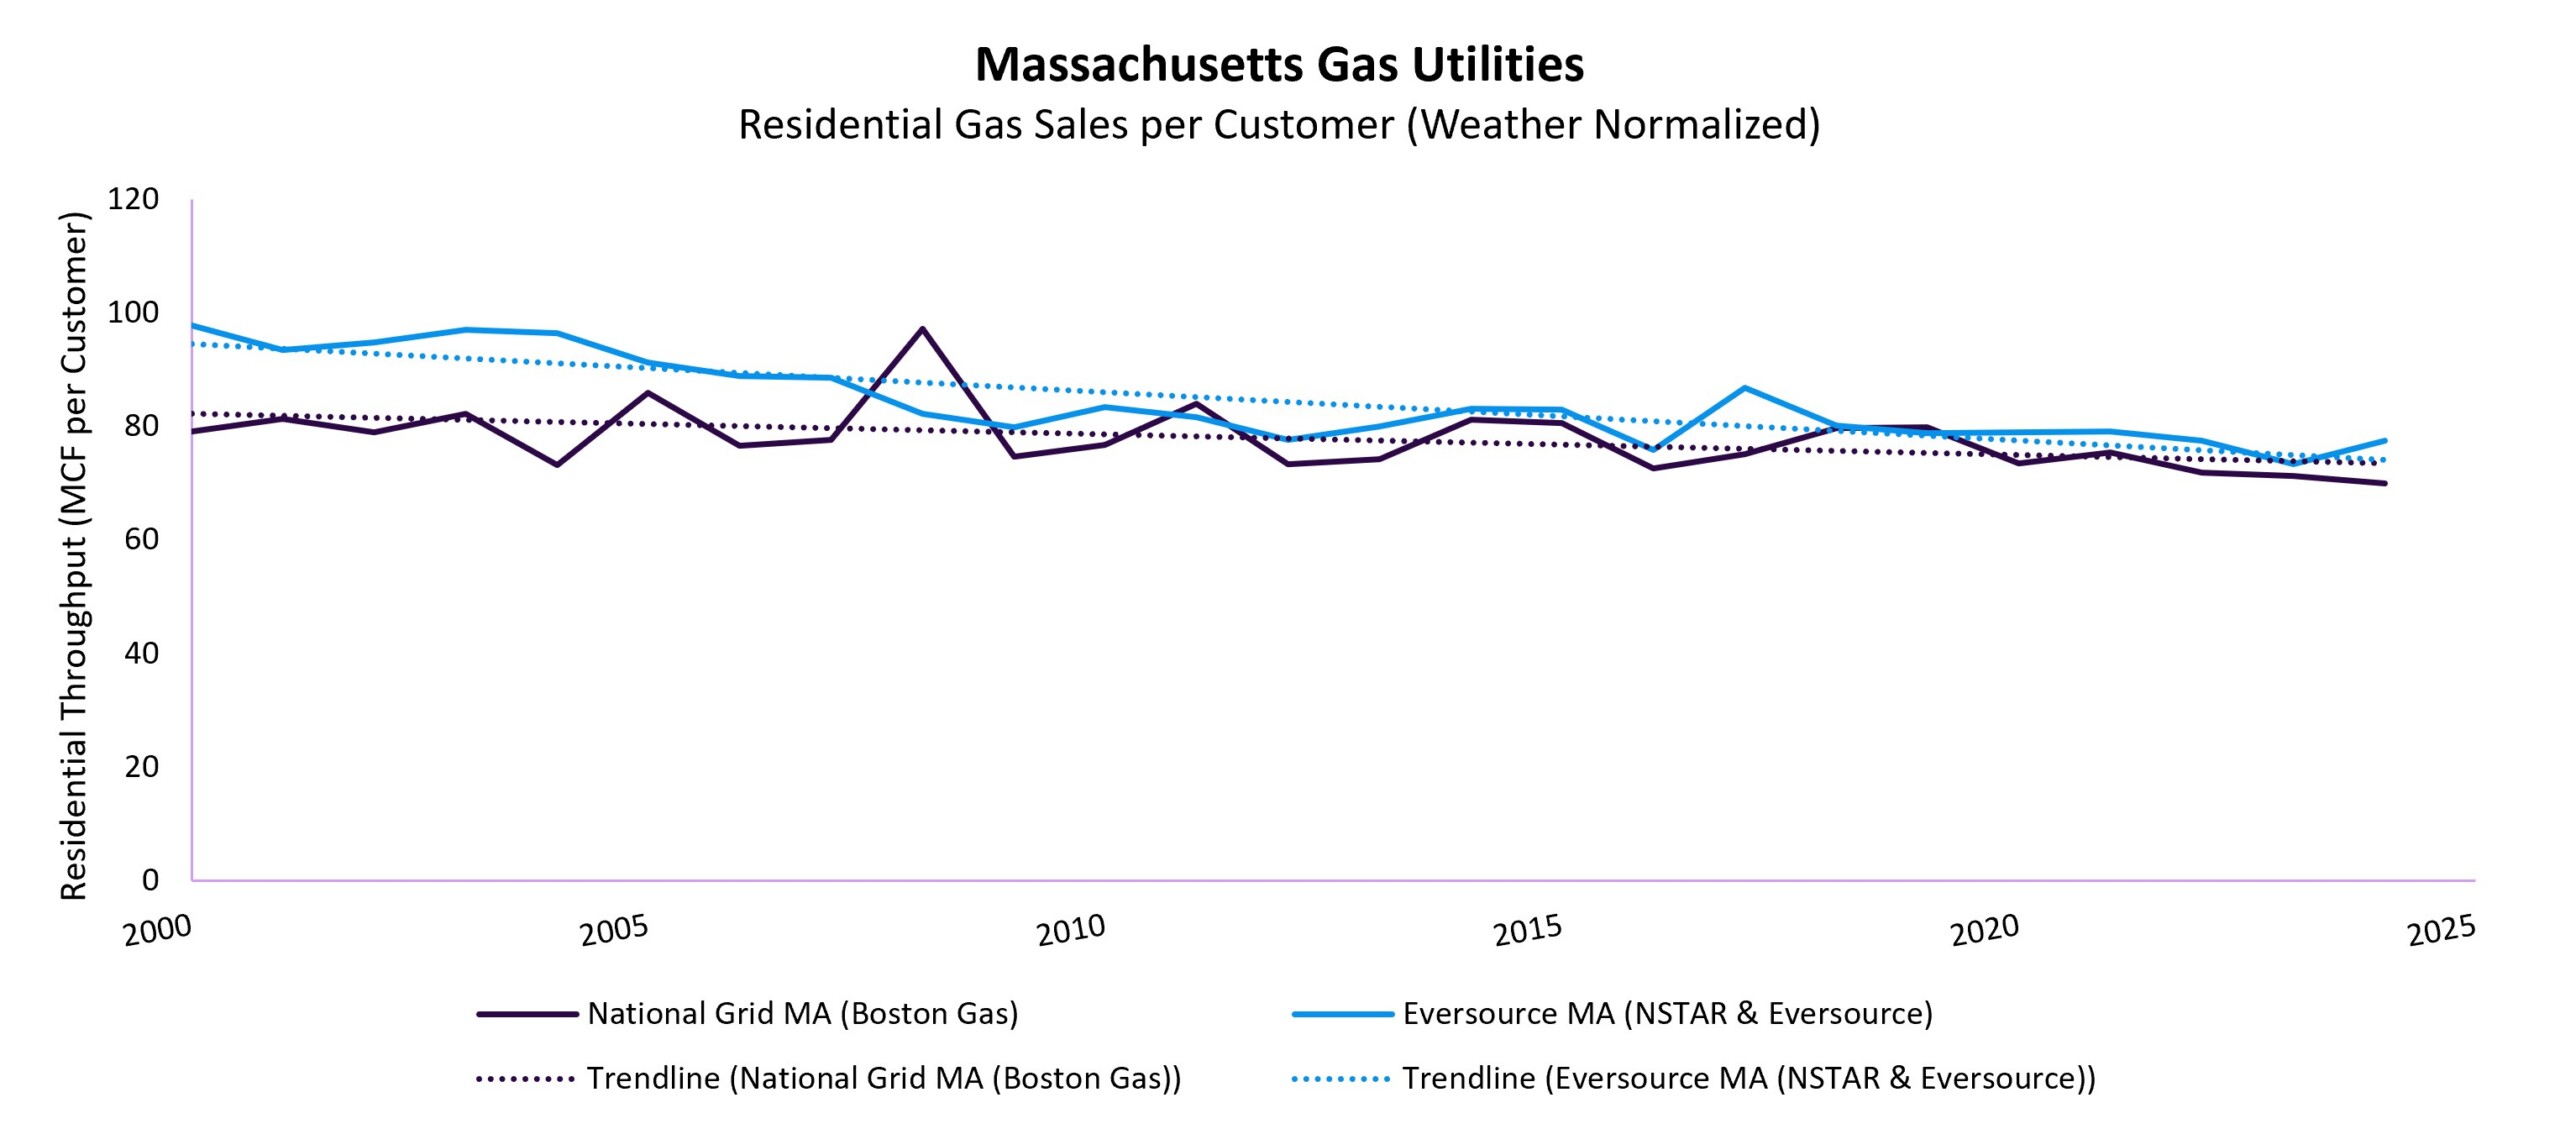
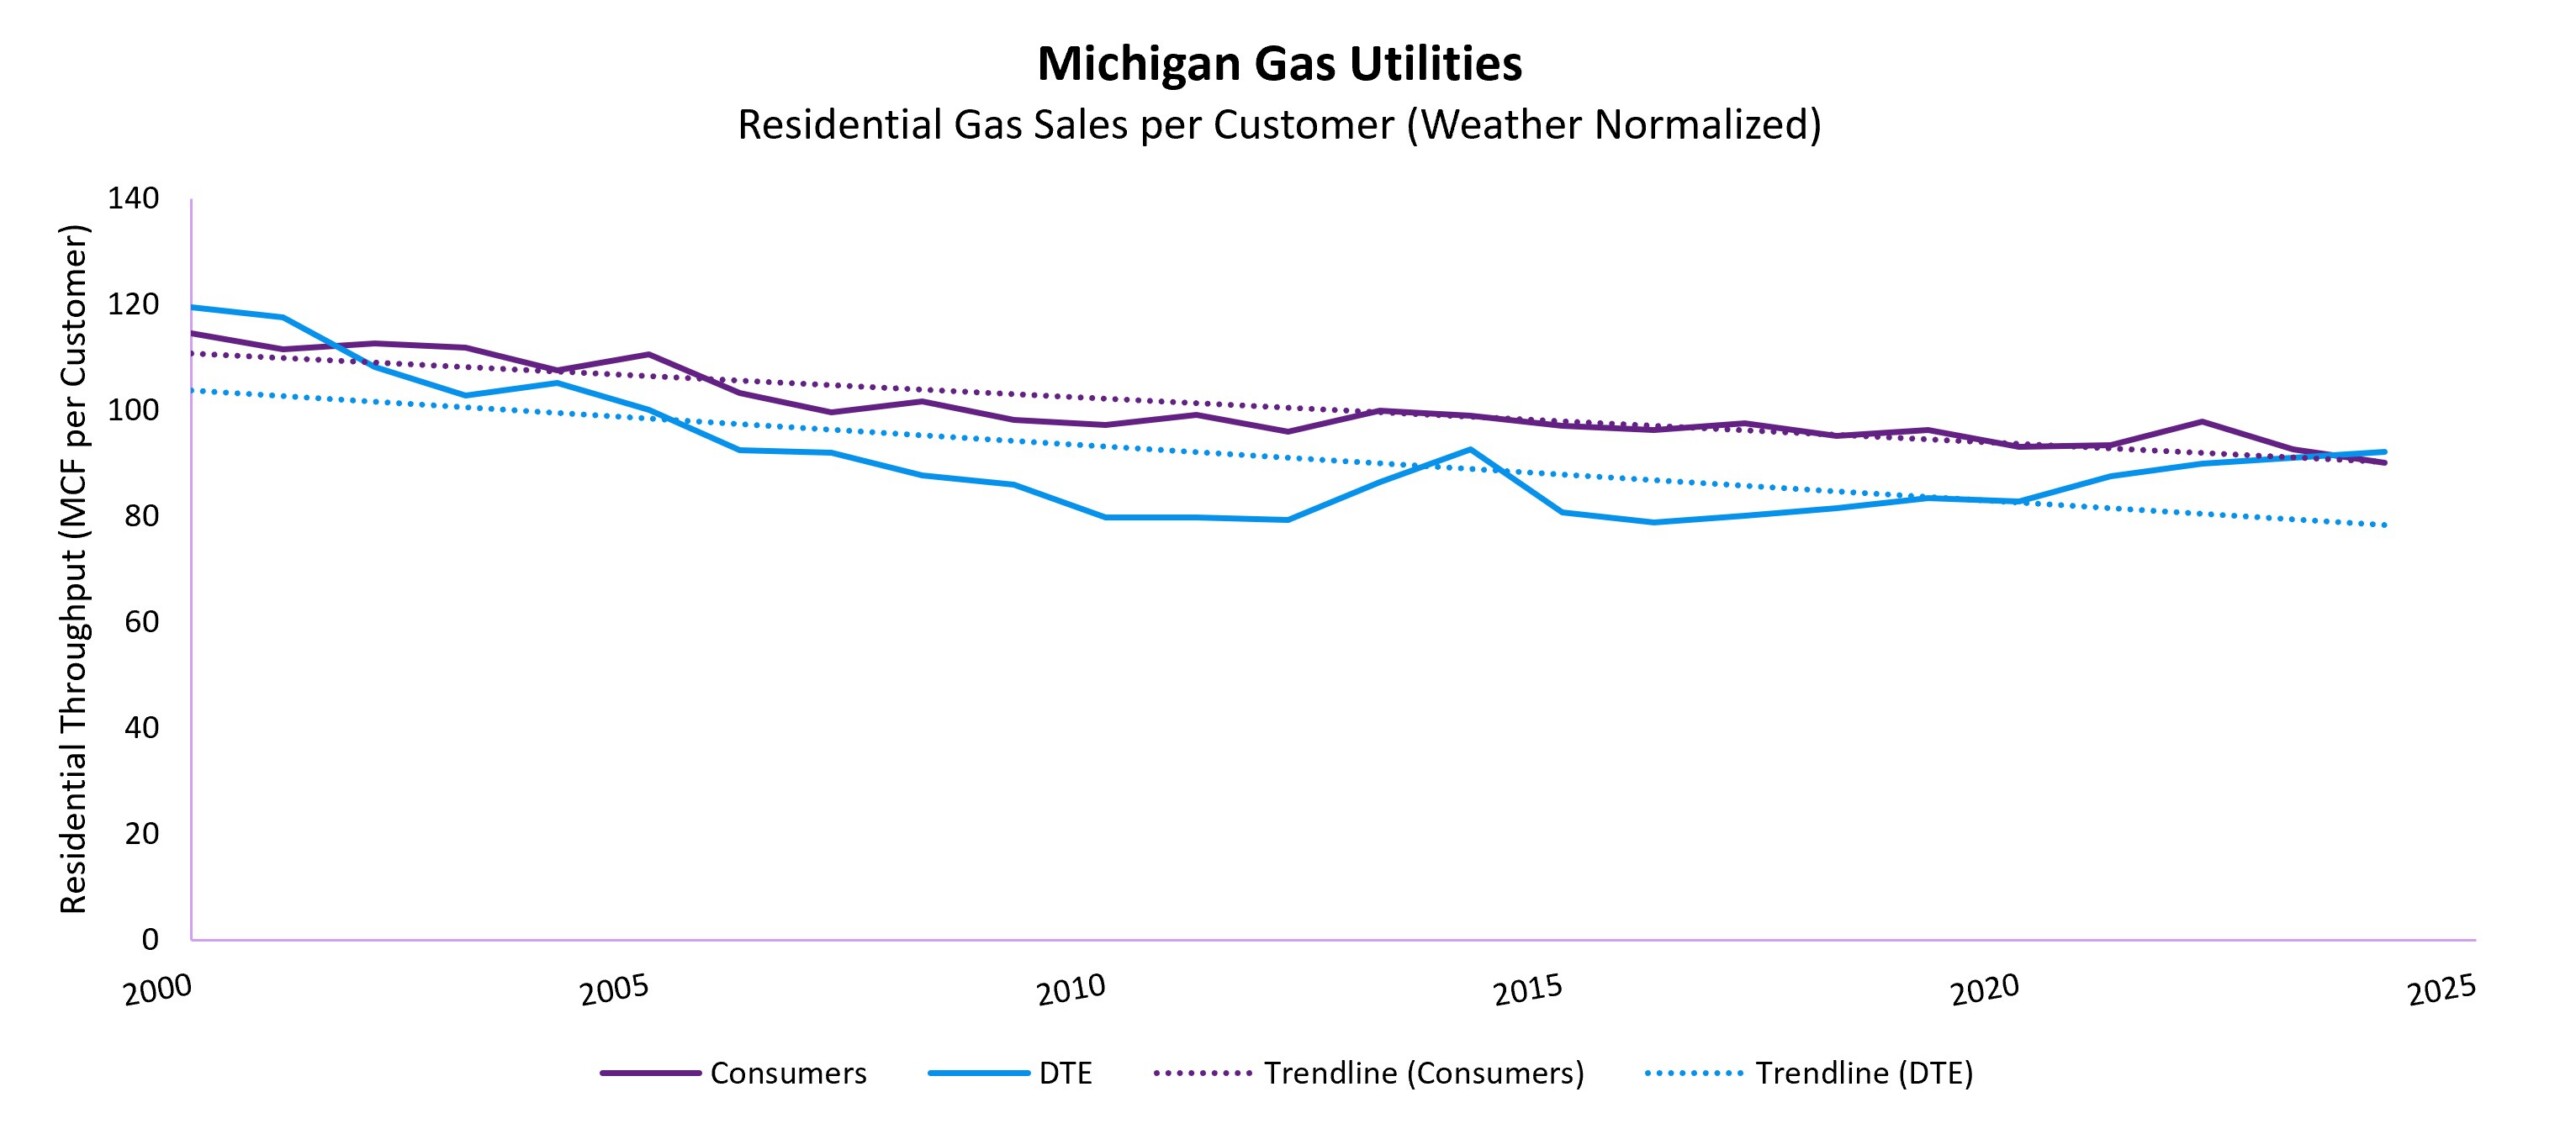
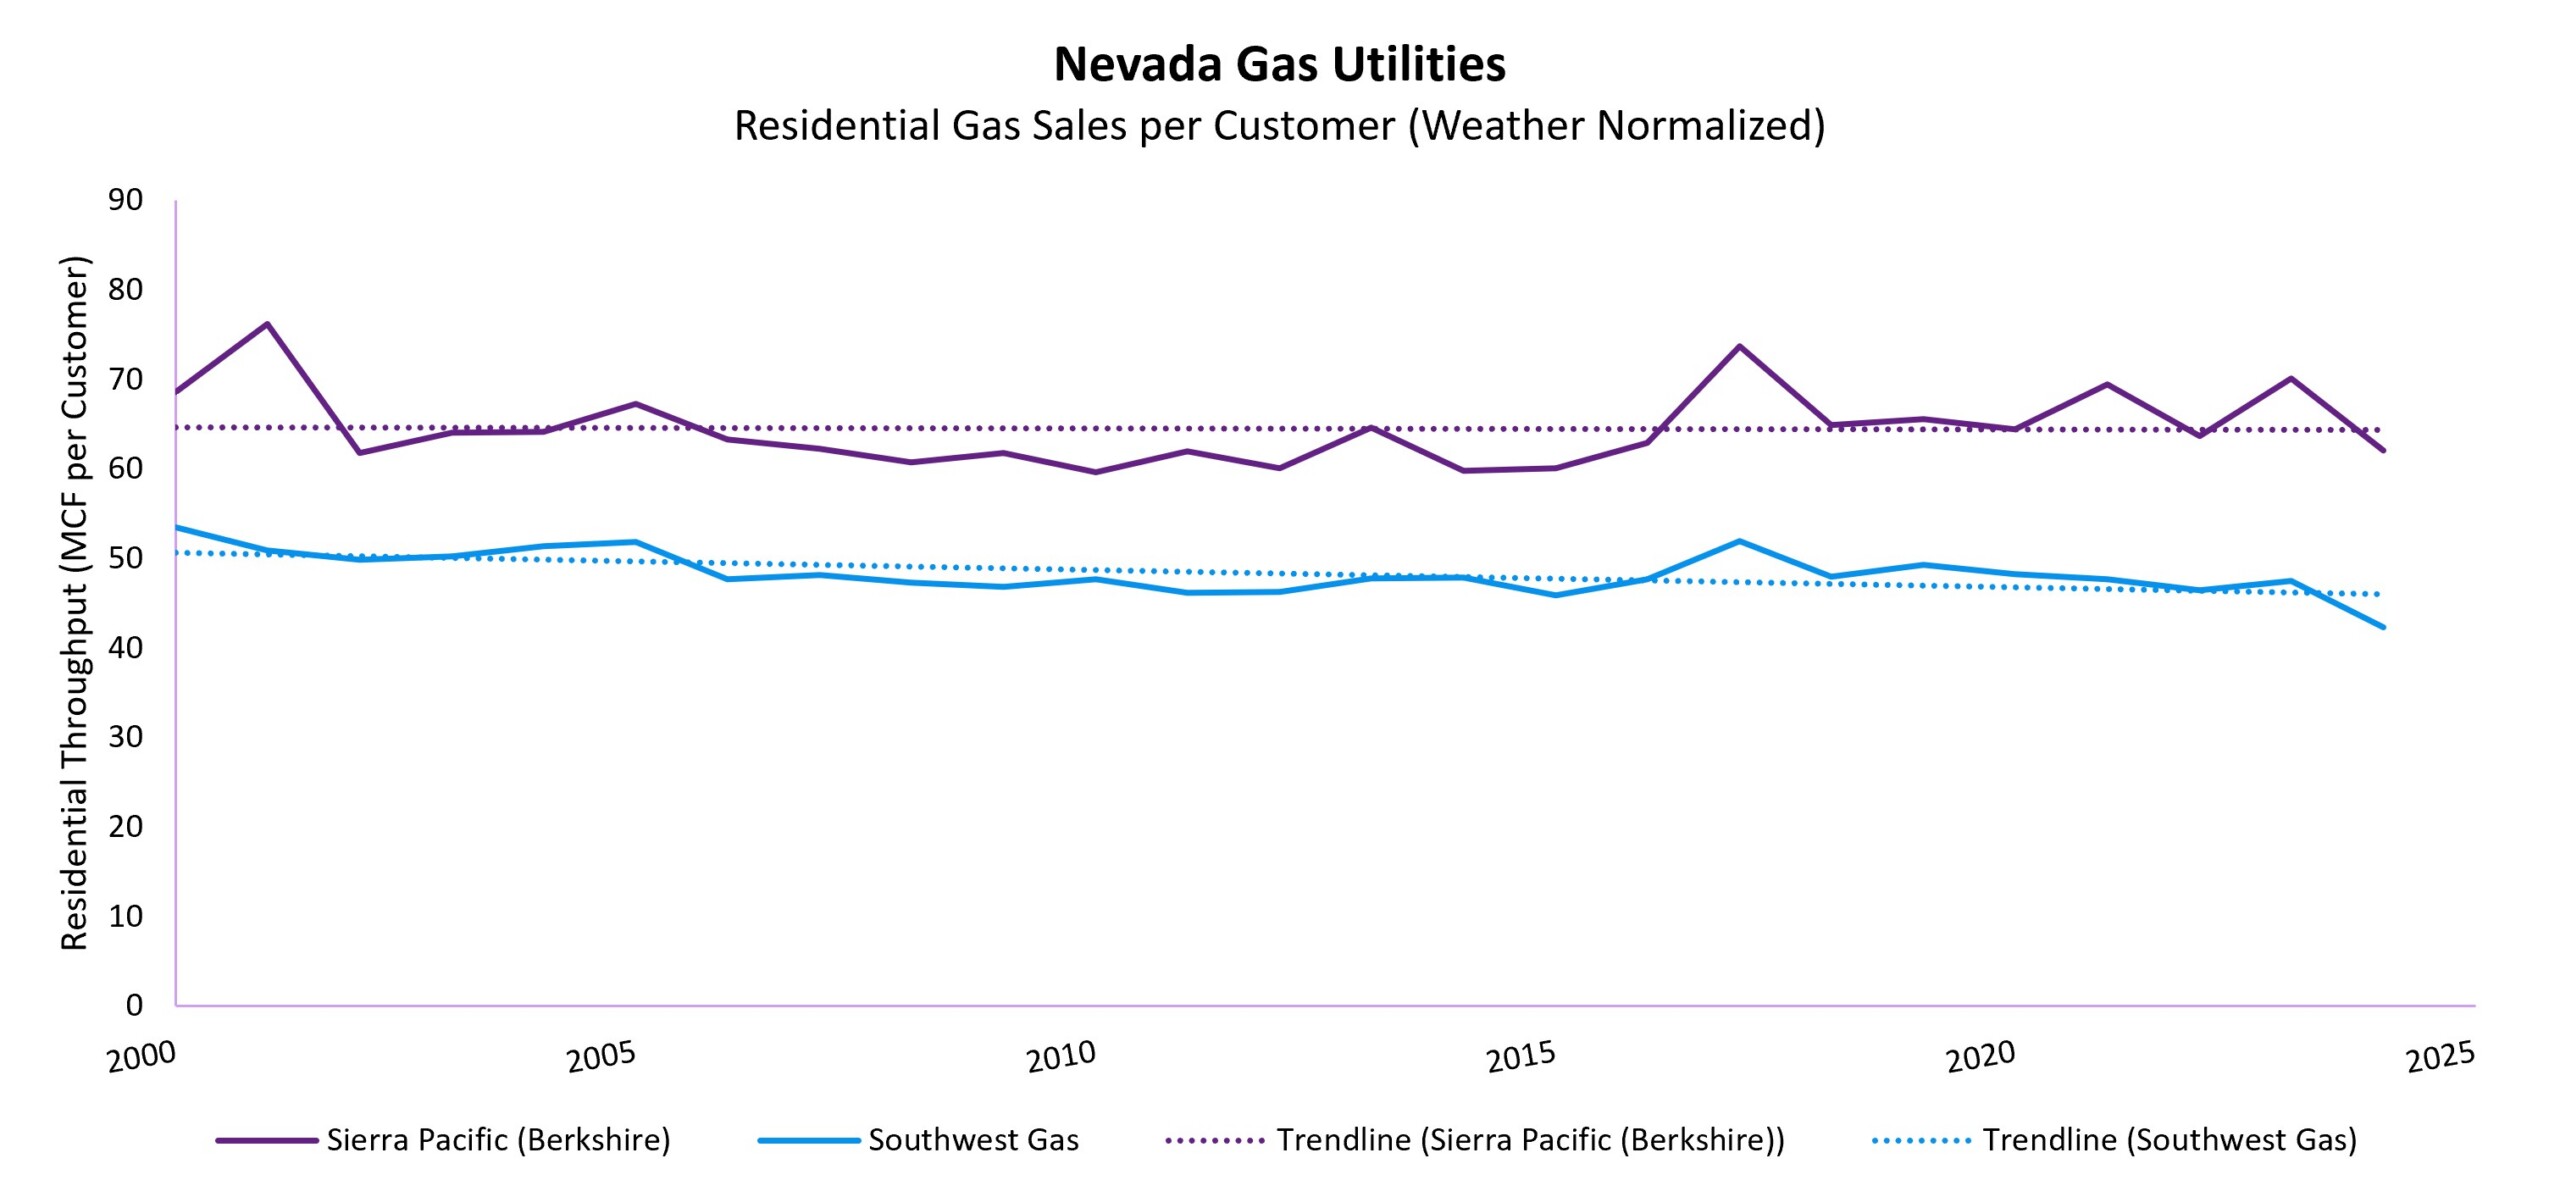
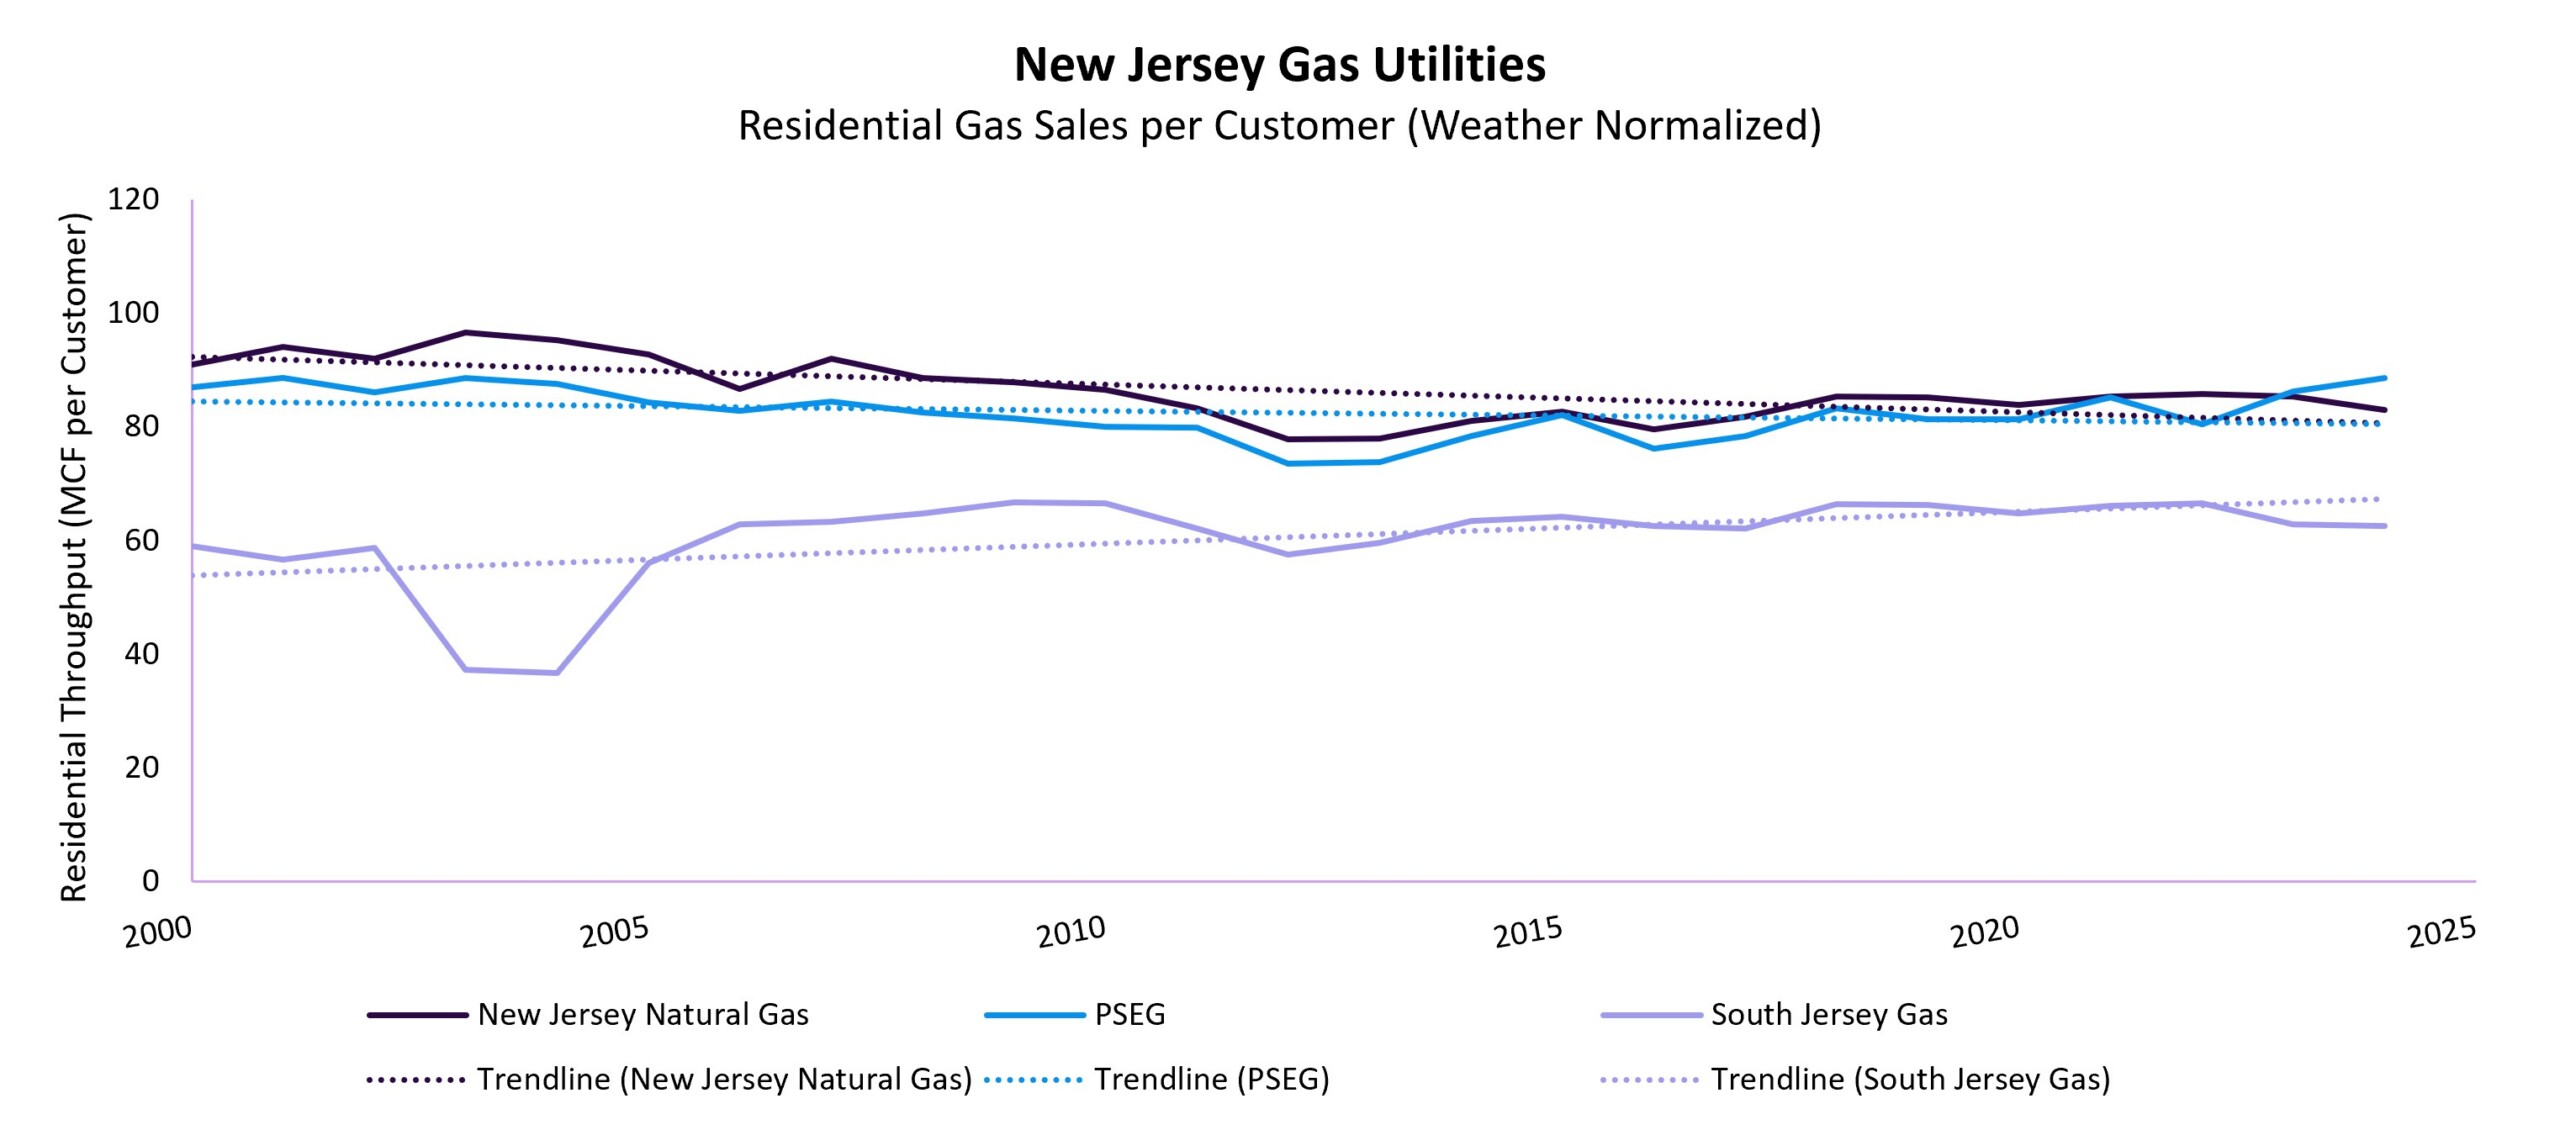
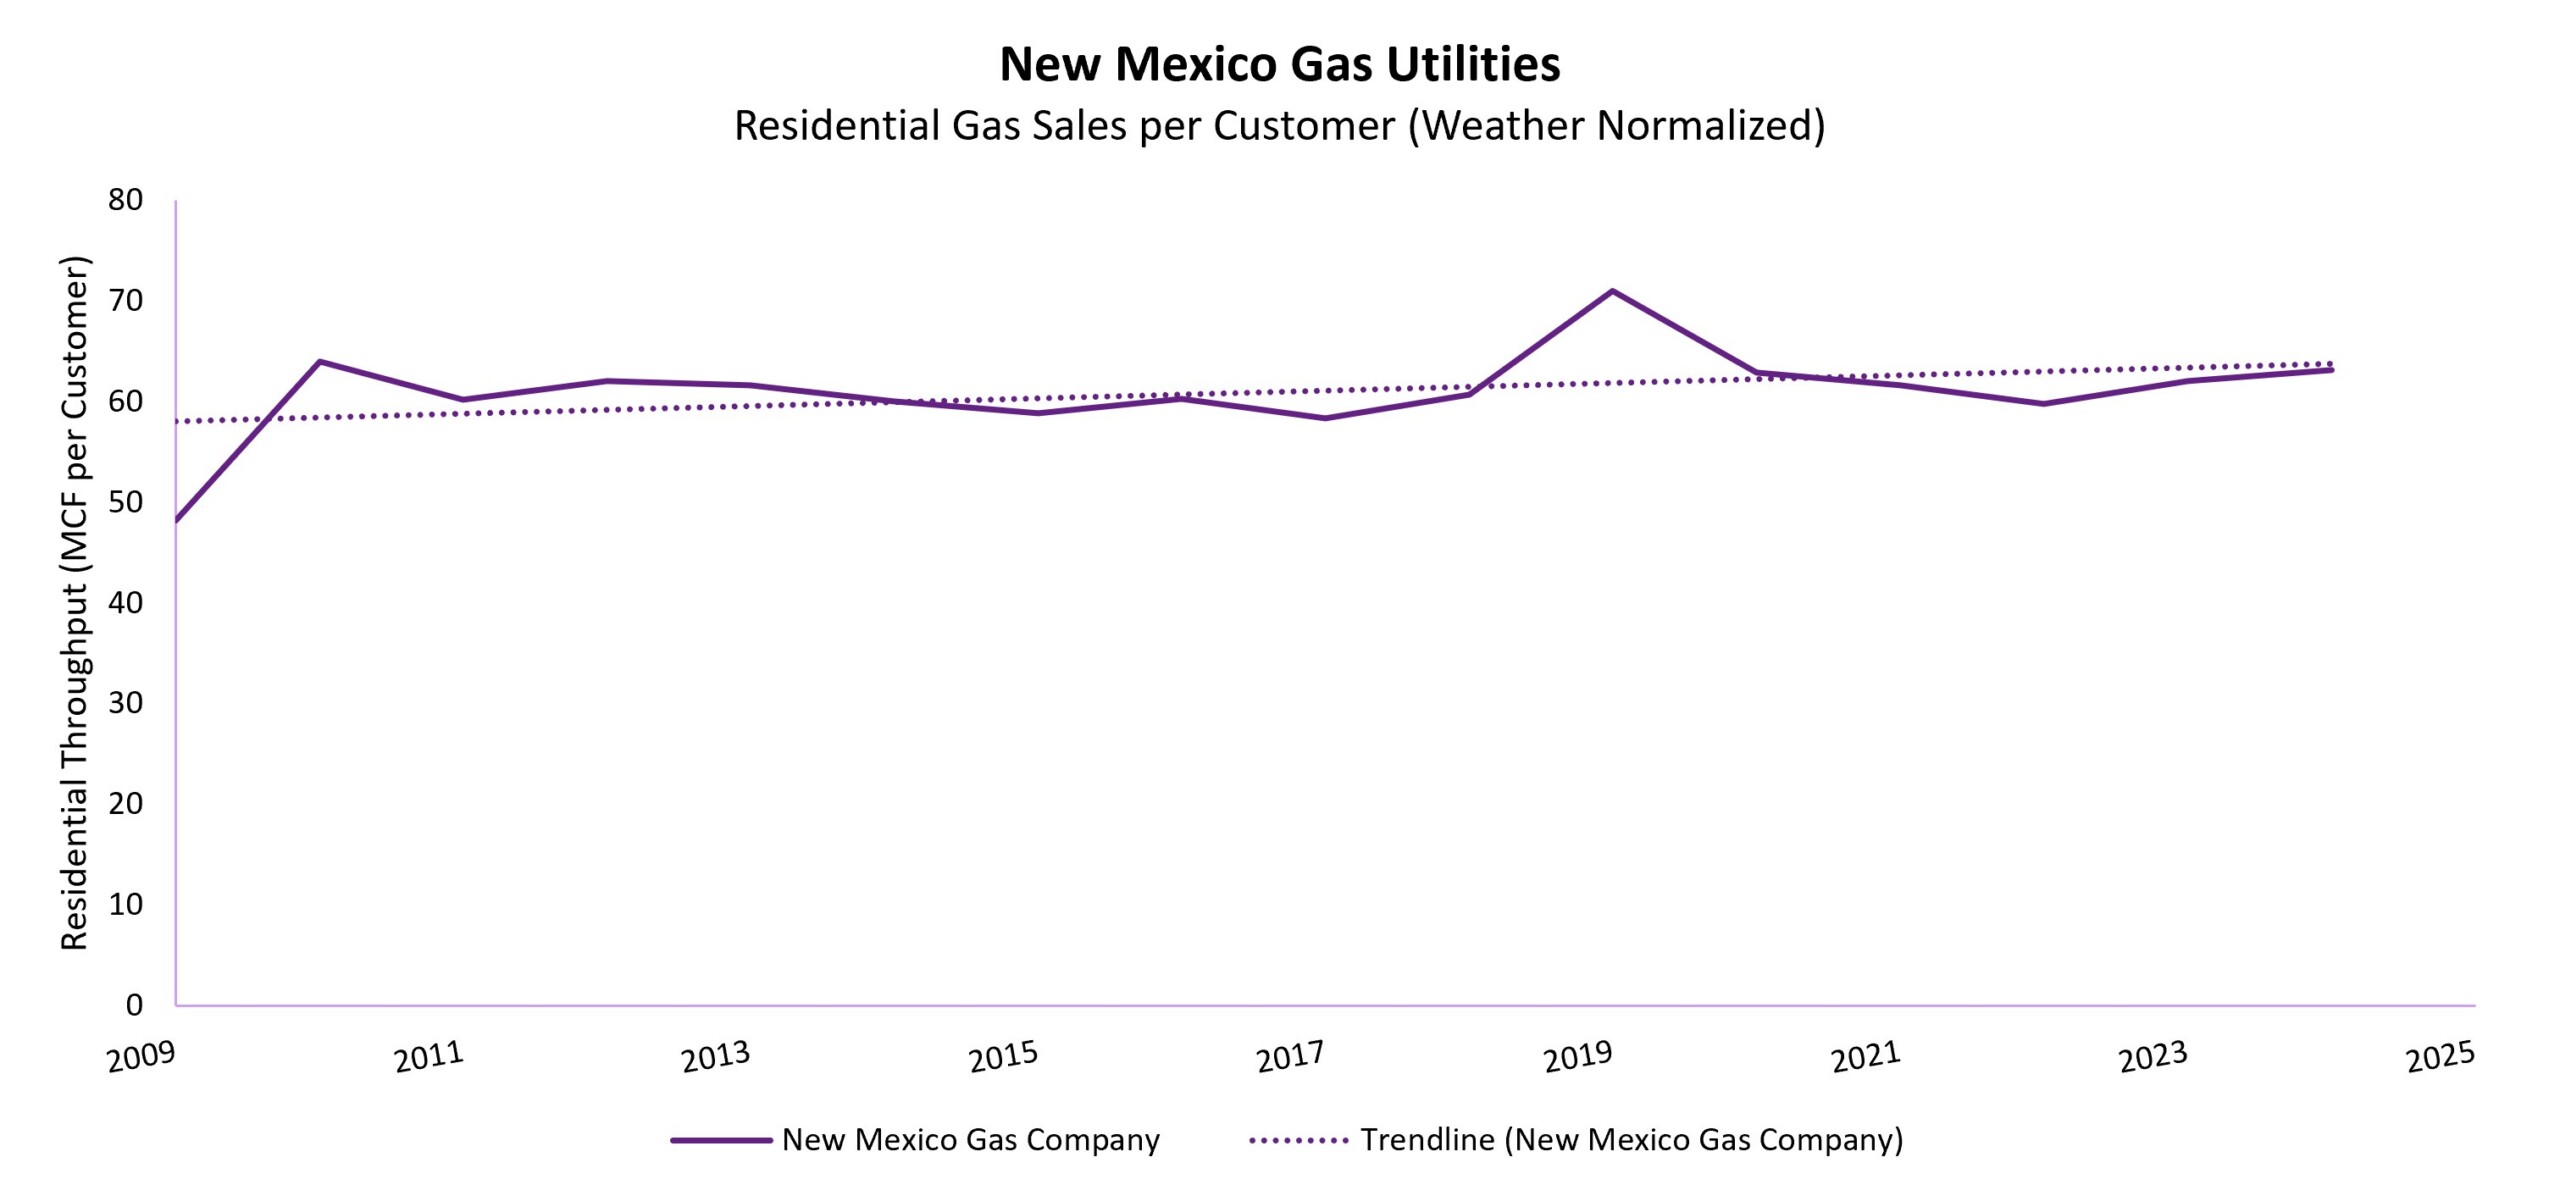
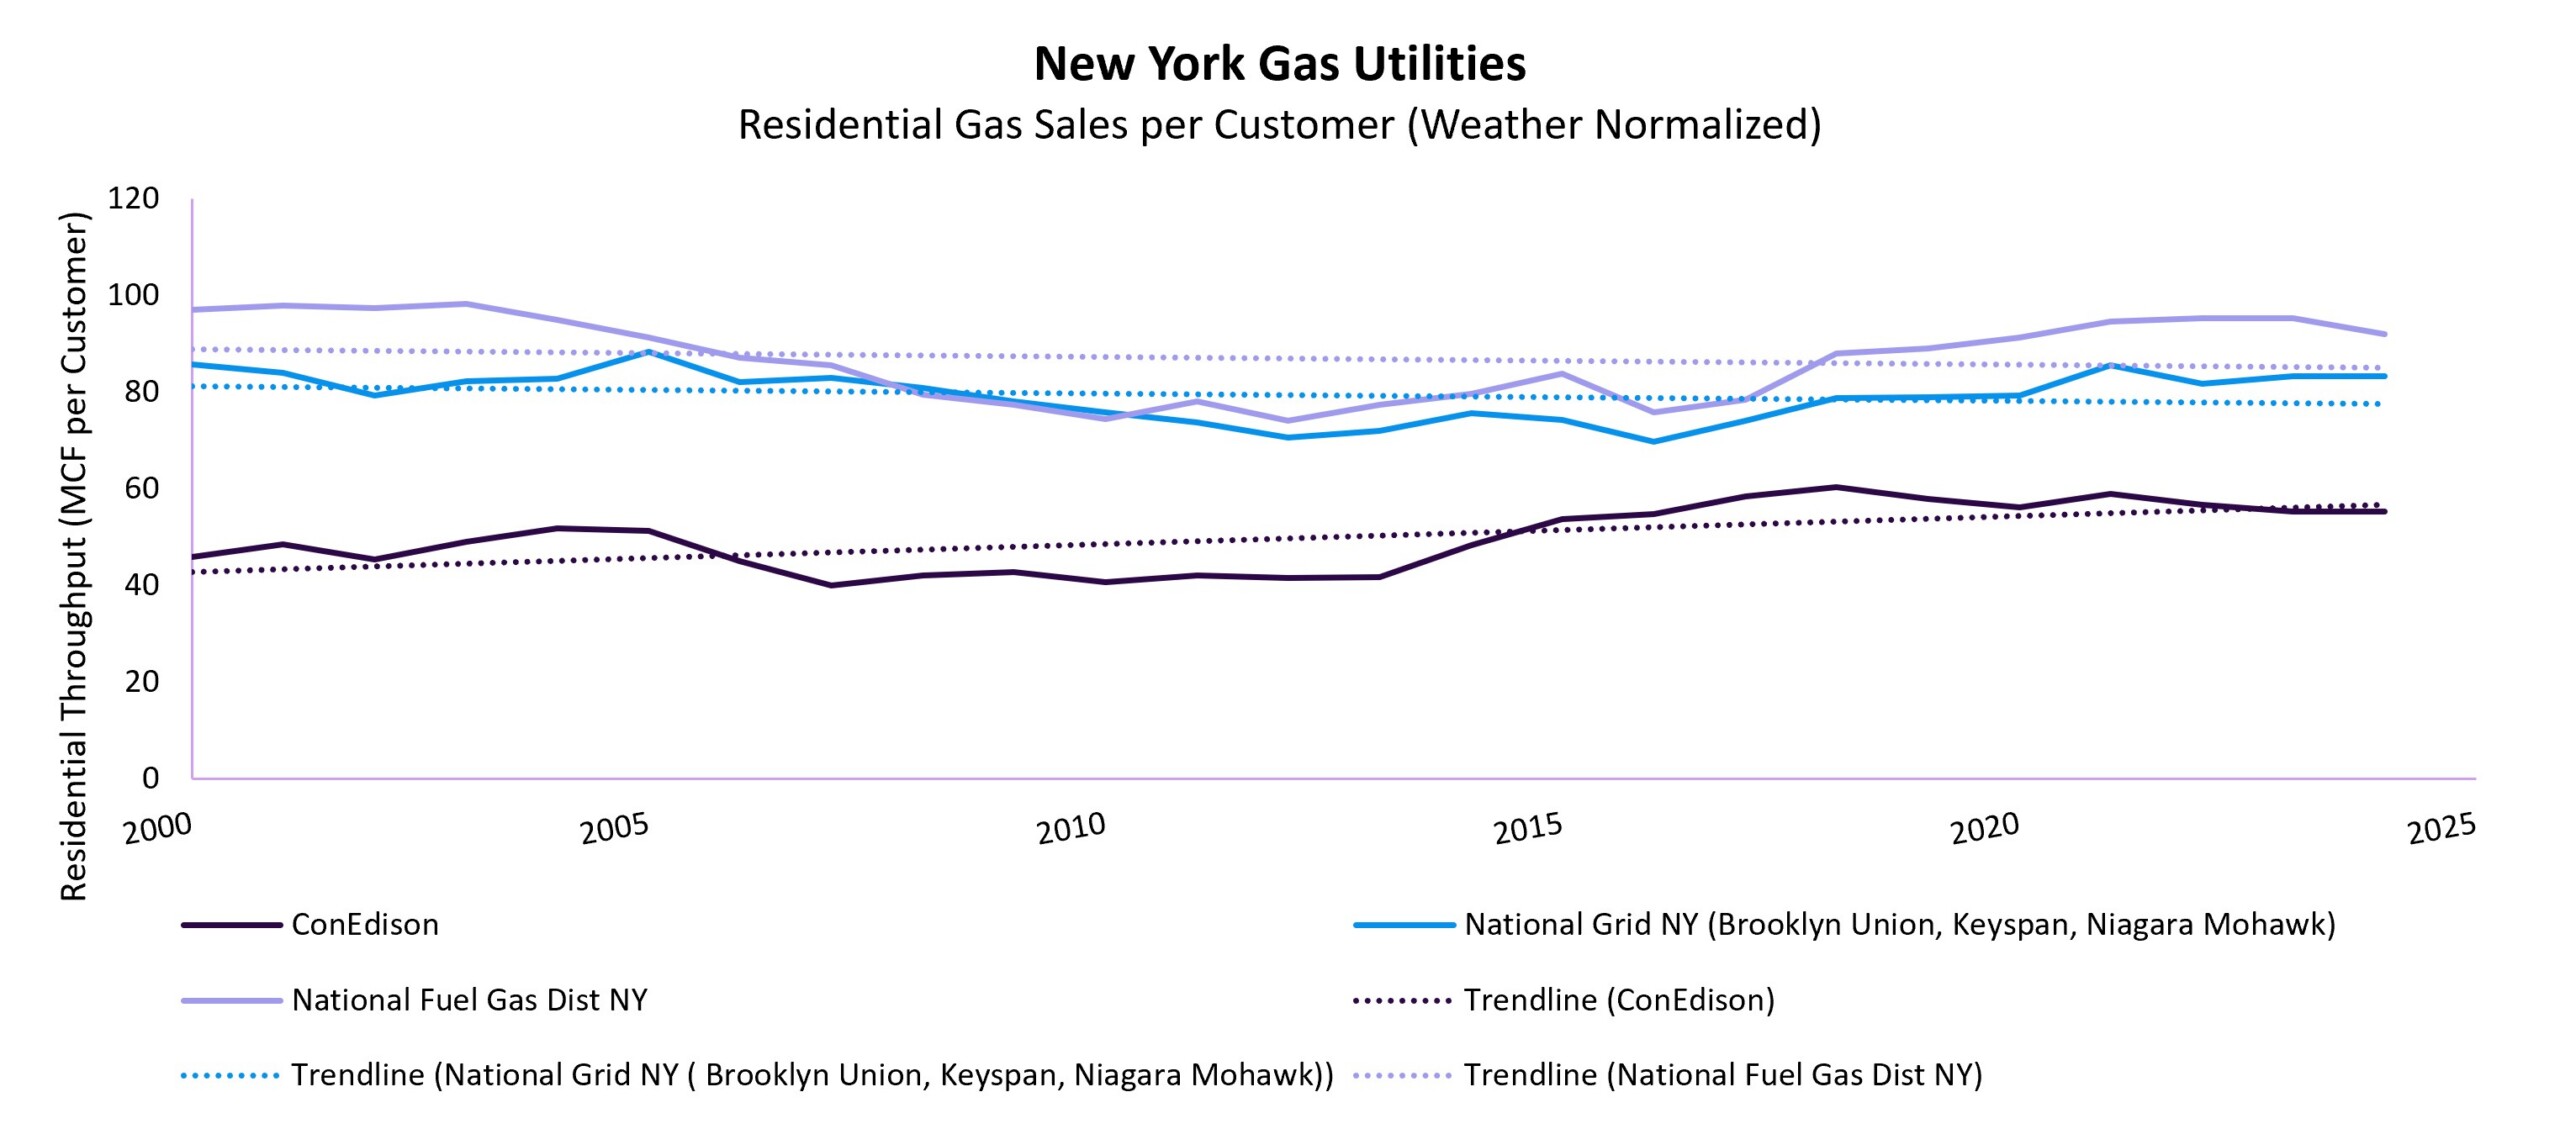
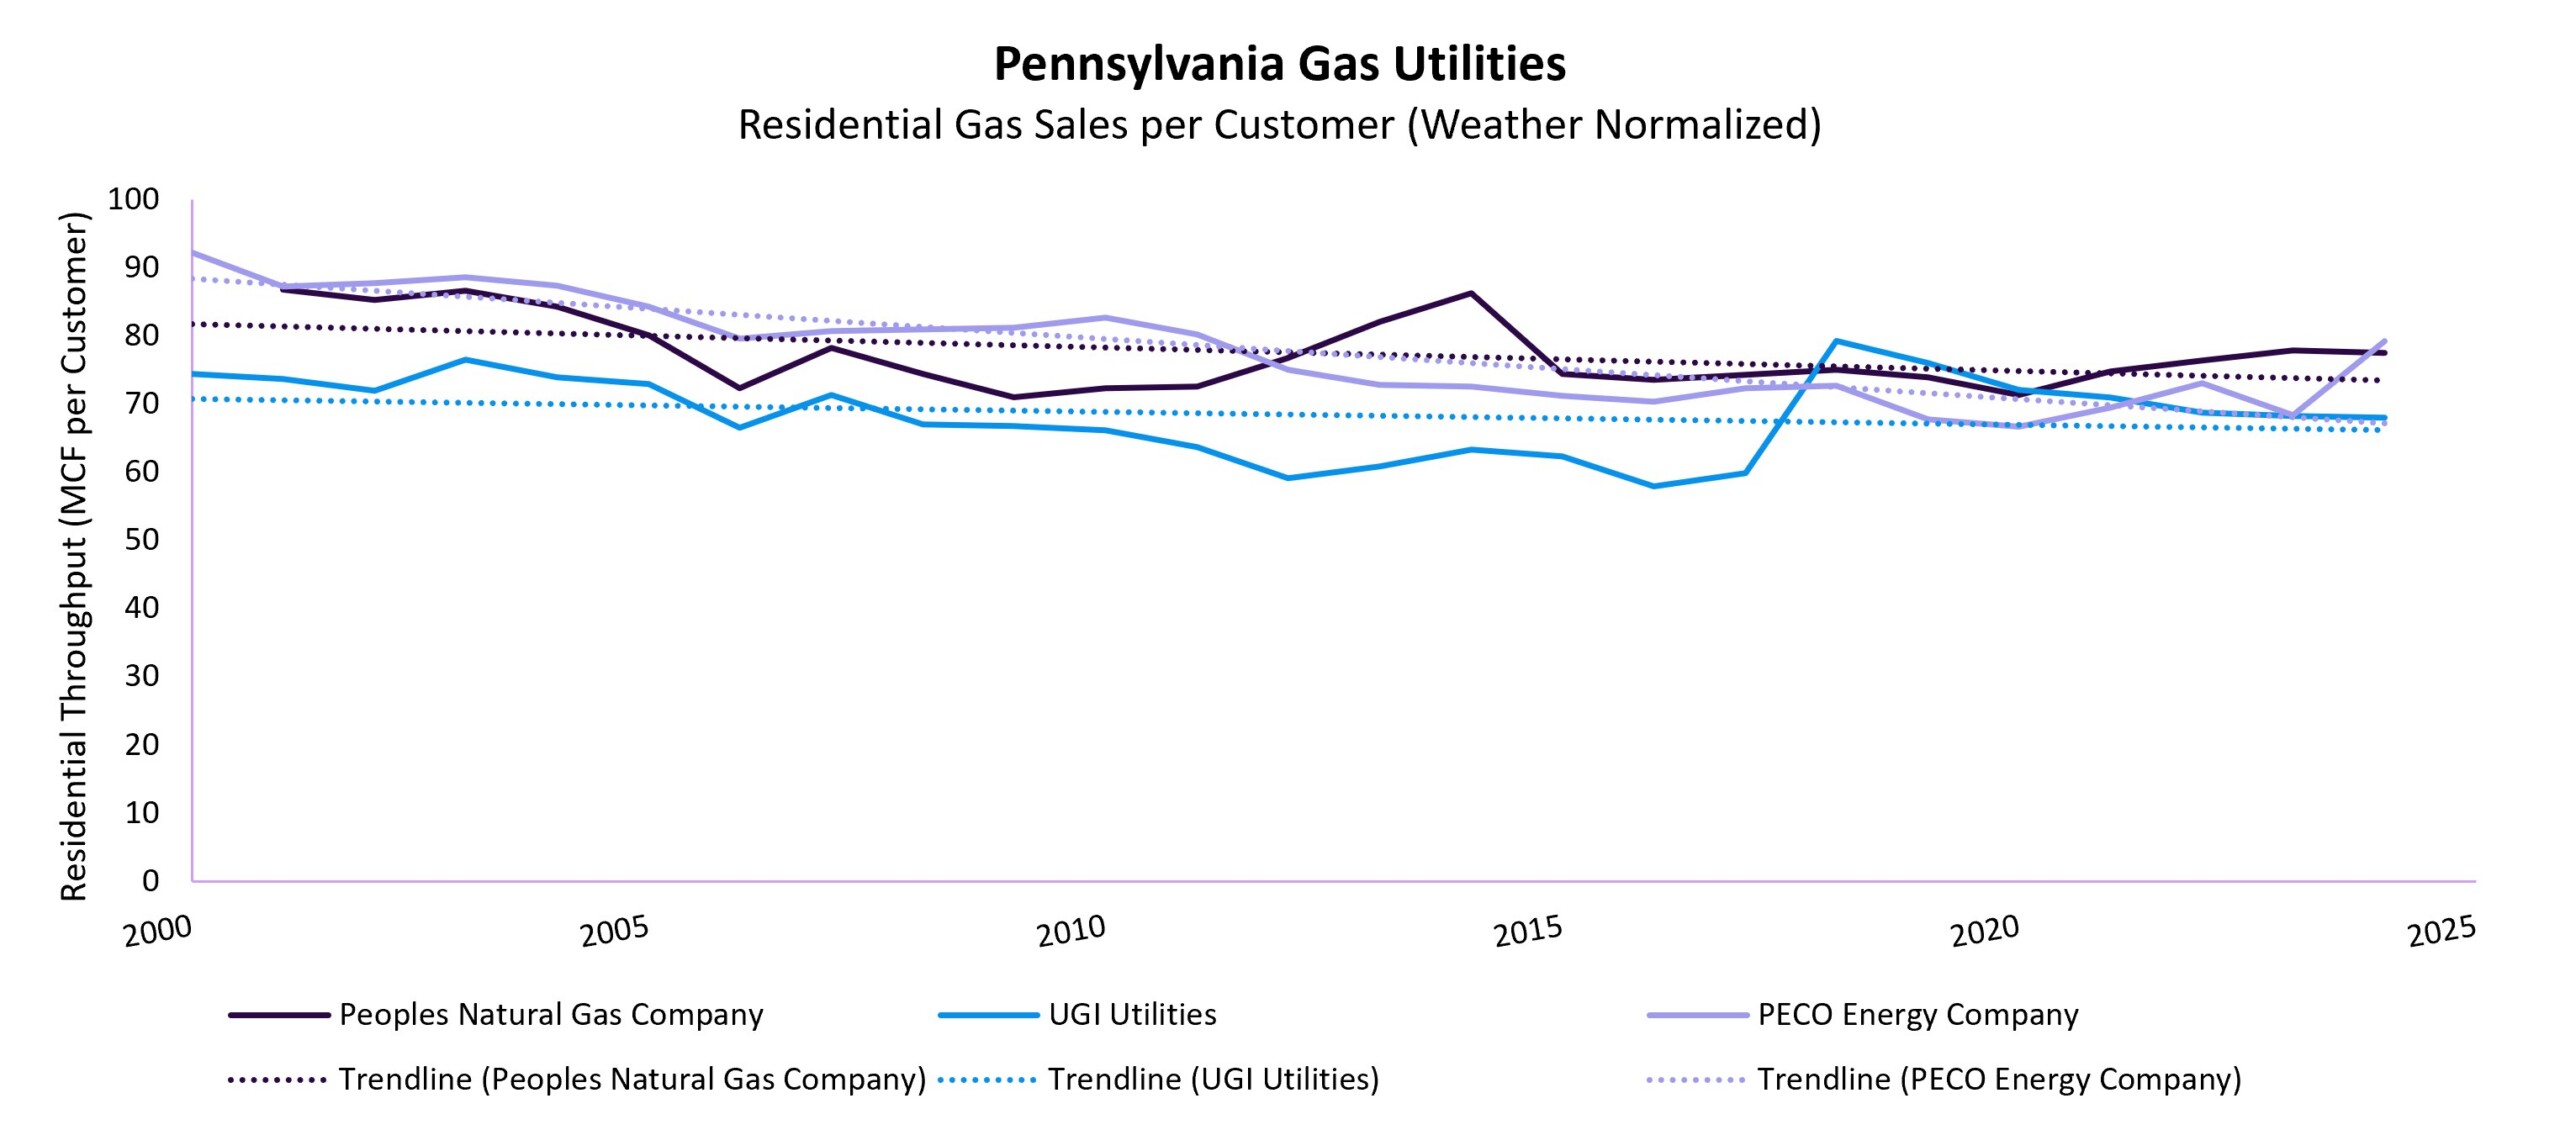
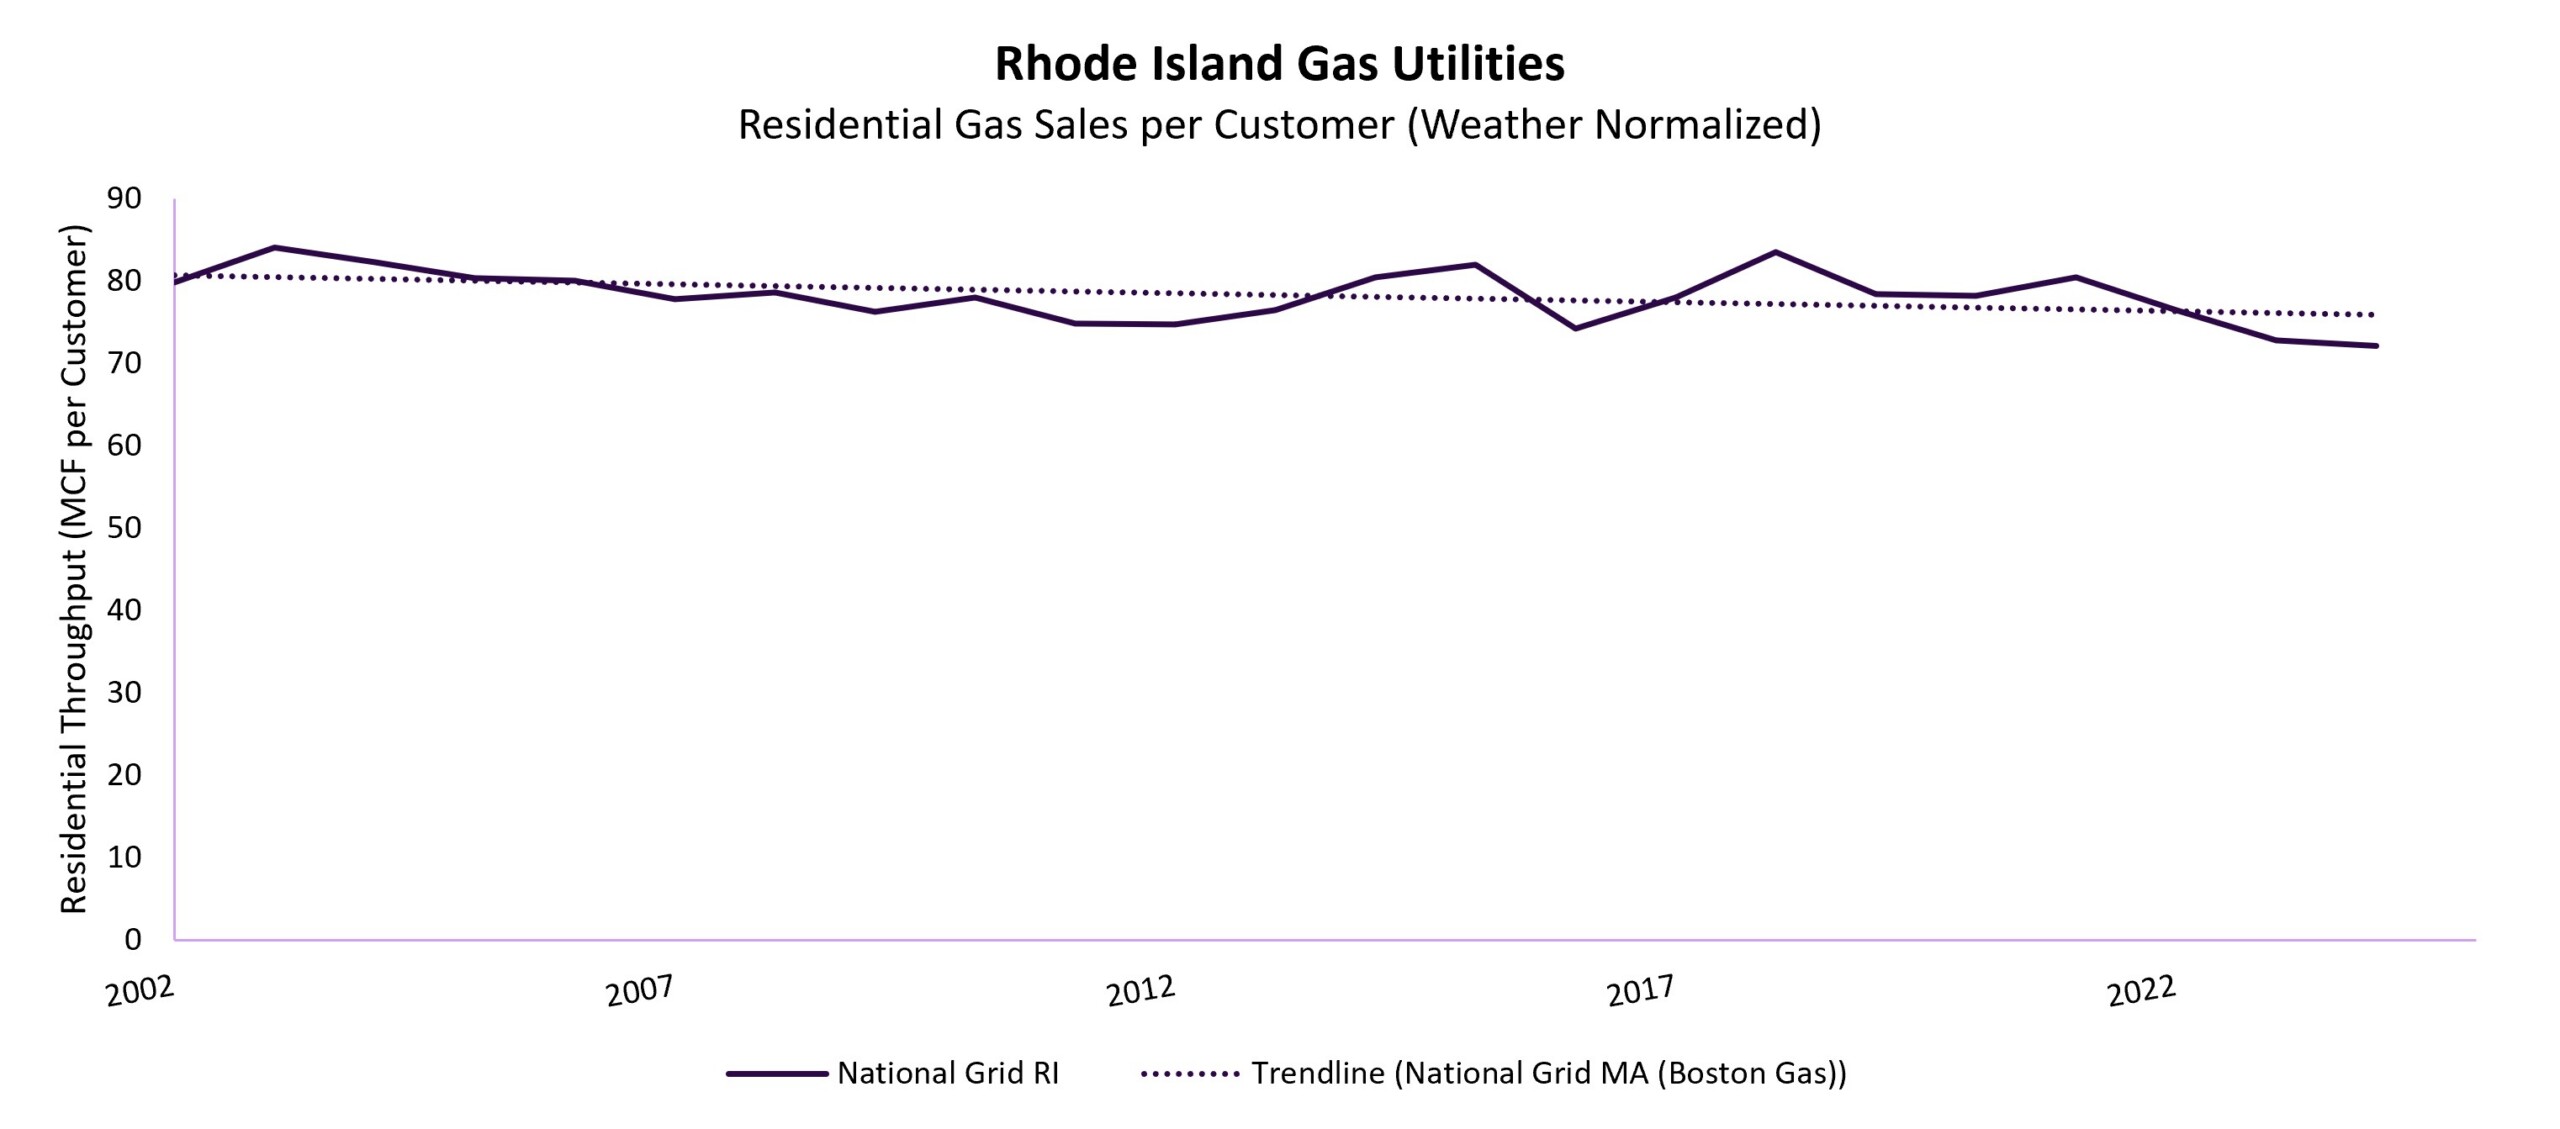
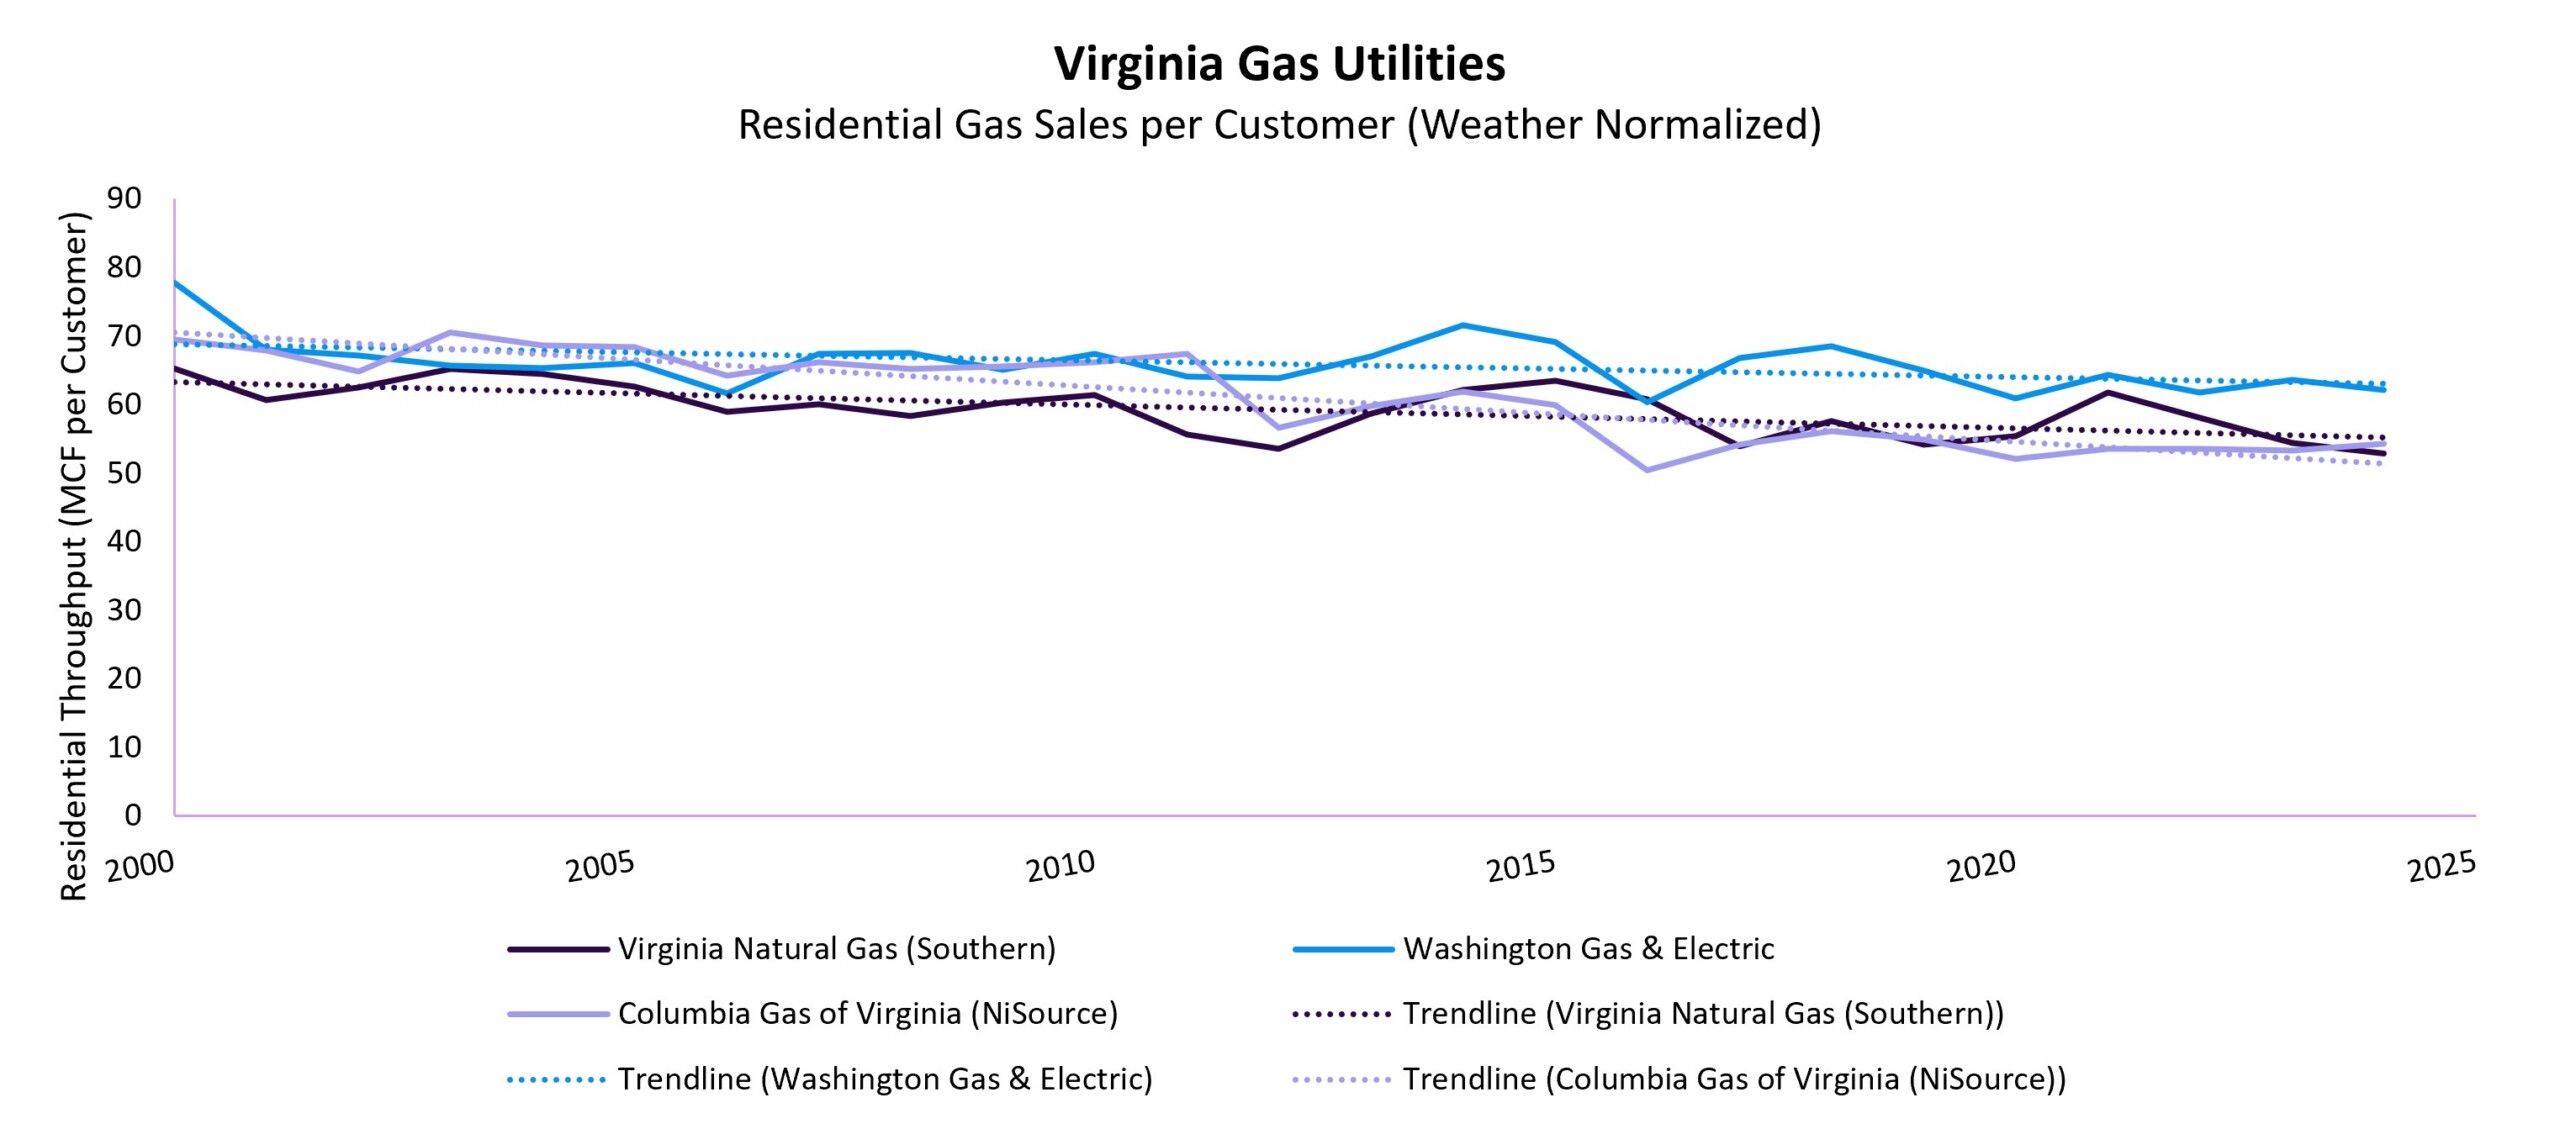
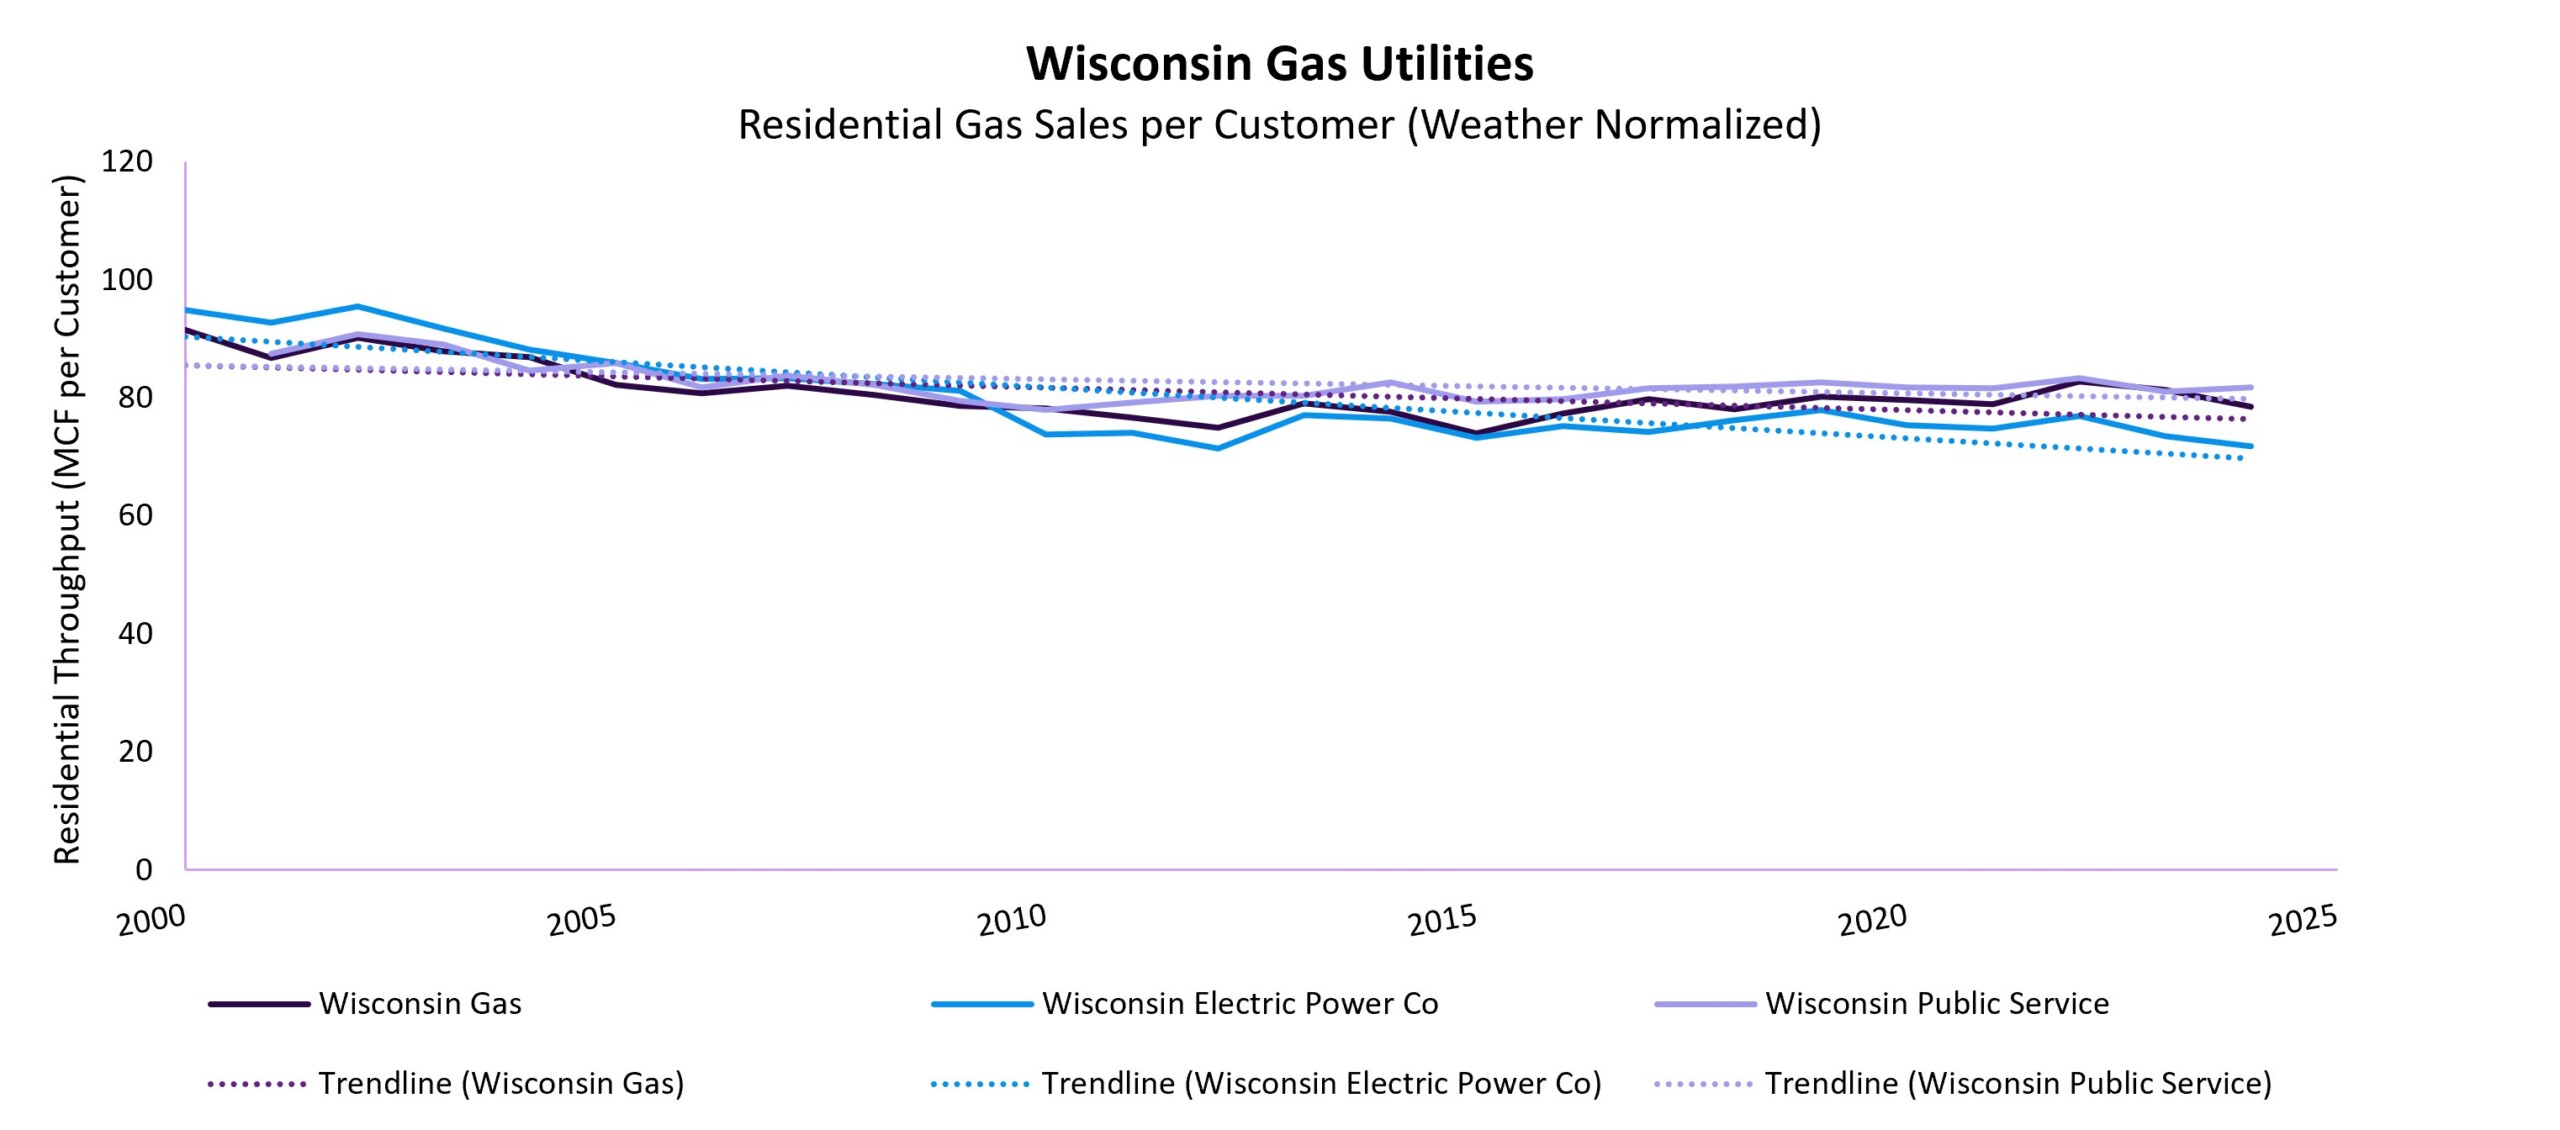
Across the country, the average natural gas consumption per residential customer has slowly and steadily declined since the early 2000s. The above state-level graphs show residential gas sales per customer across major gas investor-owned utilities (IOUs). According to data reported to EIA, several utilities bucked the trend, including Sierra Pacific Power Company (serving gas to Northern Nevada customers), which remained flat, and Michigan’s DTE, New Jersey’s South Jersey Gas, New York’s Consolidated Edison, and Connecticut’s Avangrid subsidiaries, which saw increases. Increased use per customer could be the result of larger homes requiring more space heating, the installation of new gas appliances (for core home heating functions or luxury ones, such as pool heaters or gas fireplaces), or changes in consumer operational decisions (e.g., adjusting the home’s heating settings).
For most consumers in the other states and utility territories included in this piece, gas appliances have become more efficient, states have passed stronger building energy codes, and utilities, state governments, and local jurisdictions offer energy efficiency and weatherization programs that lower overall energy consumption. Sales of electric heat pumps for space and water heating have also steadily grown, taking market share away from their gas equivalents. For example, in cases of partial electrification, a customer who adds a heat pump to cover most of their annual heating needs but uses their gas furnace for just a few of the coldest hours of the year would see declining use and impact this data.
Total Residential Sales
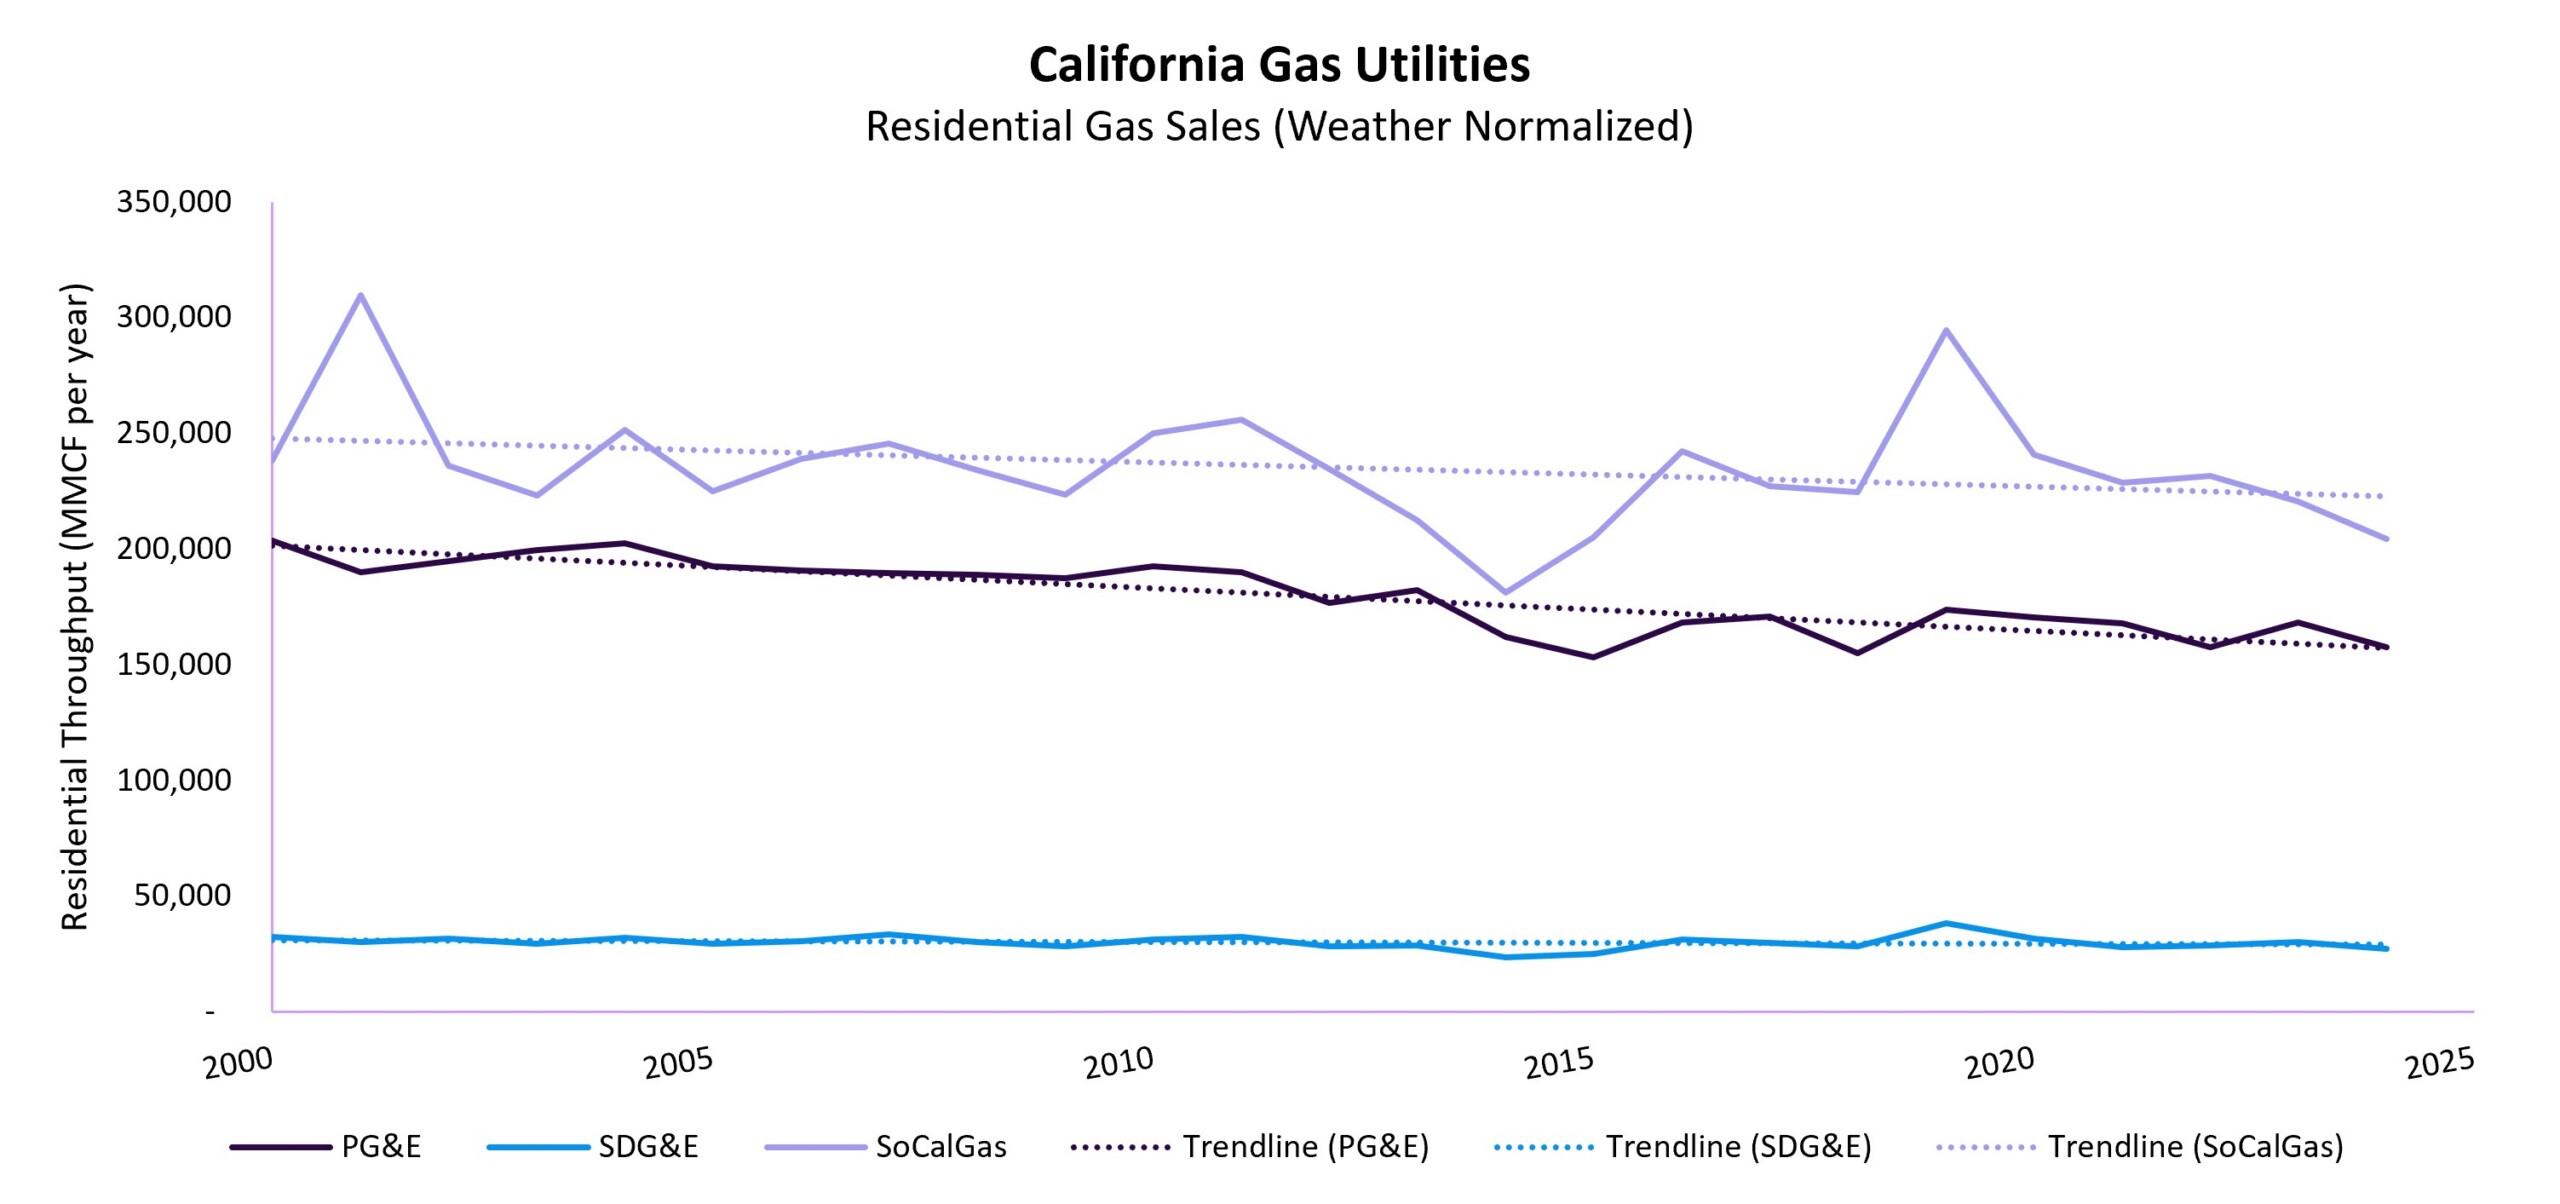
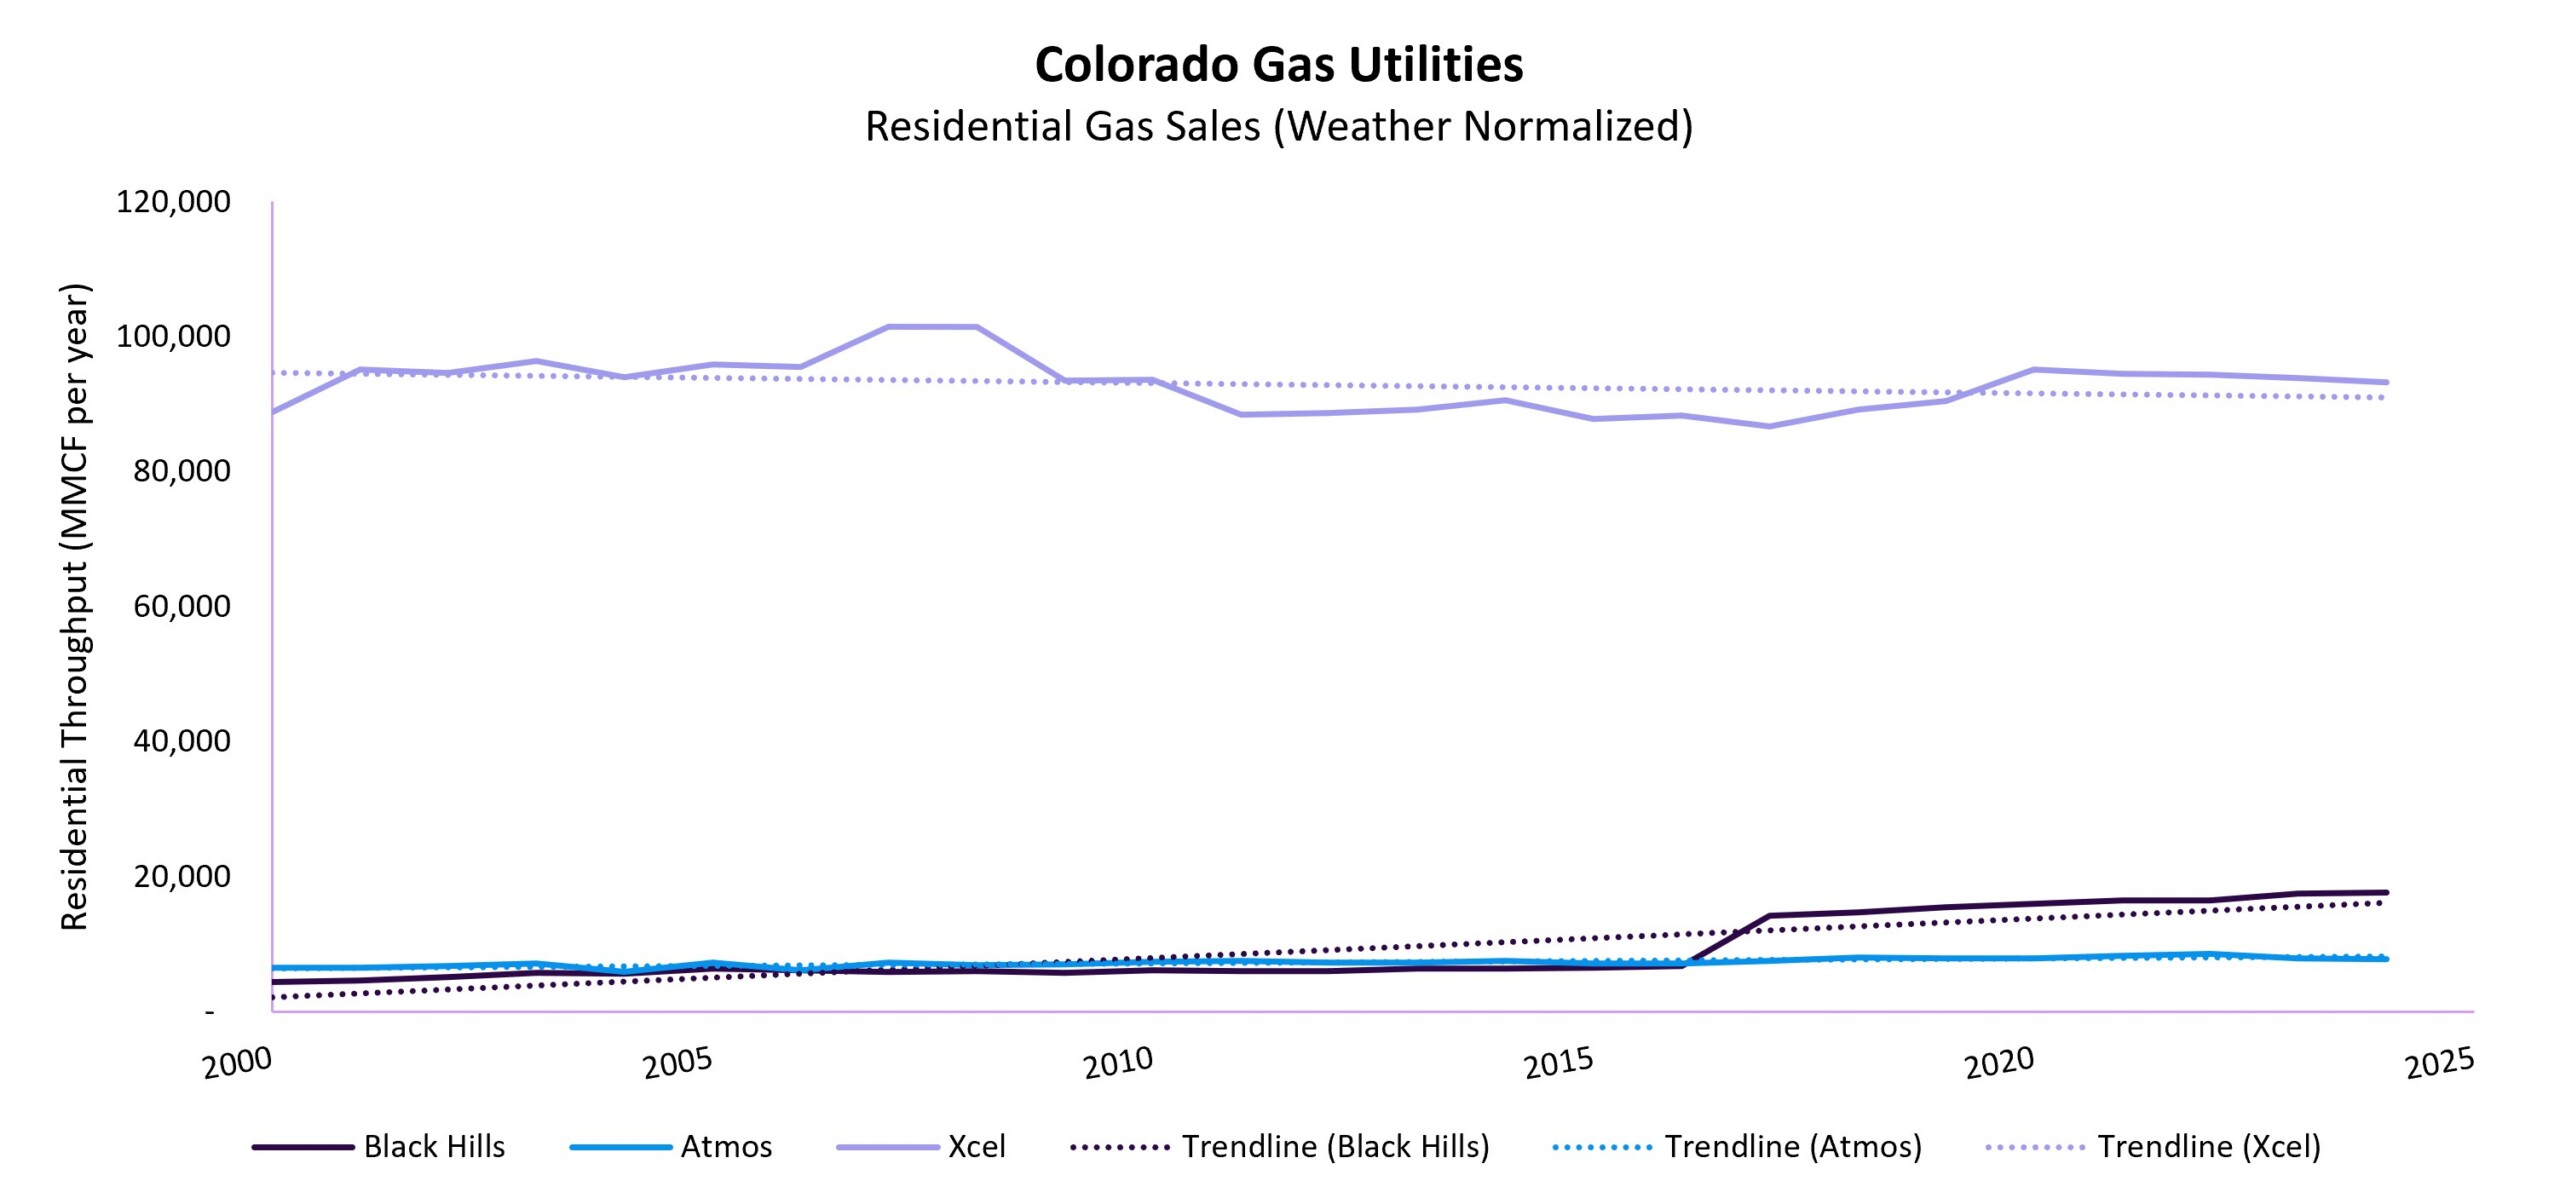
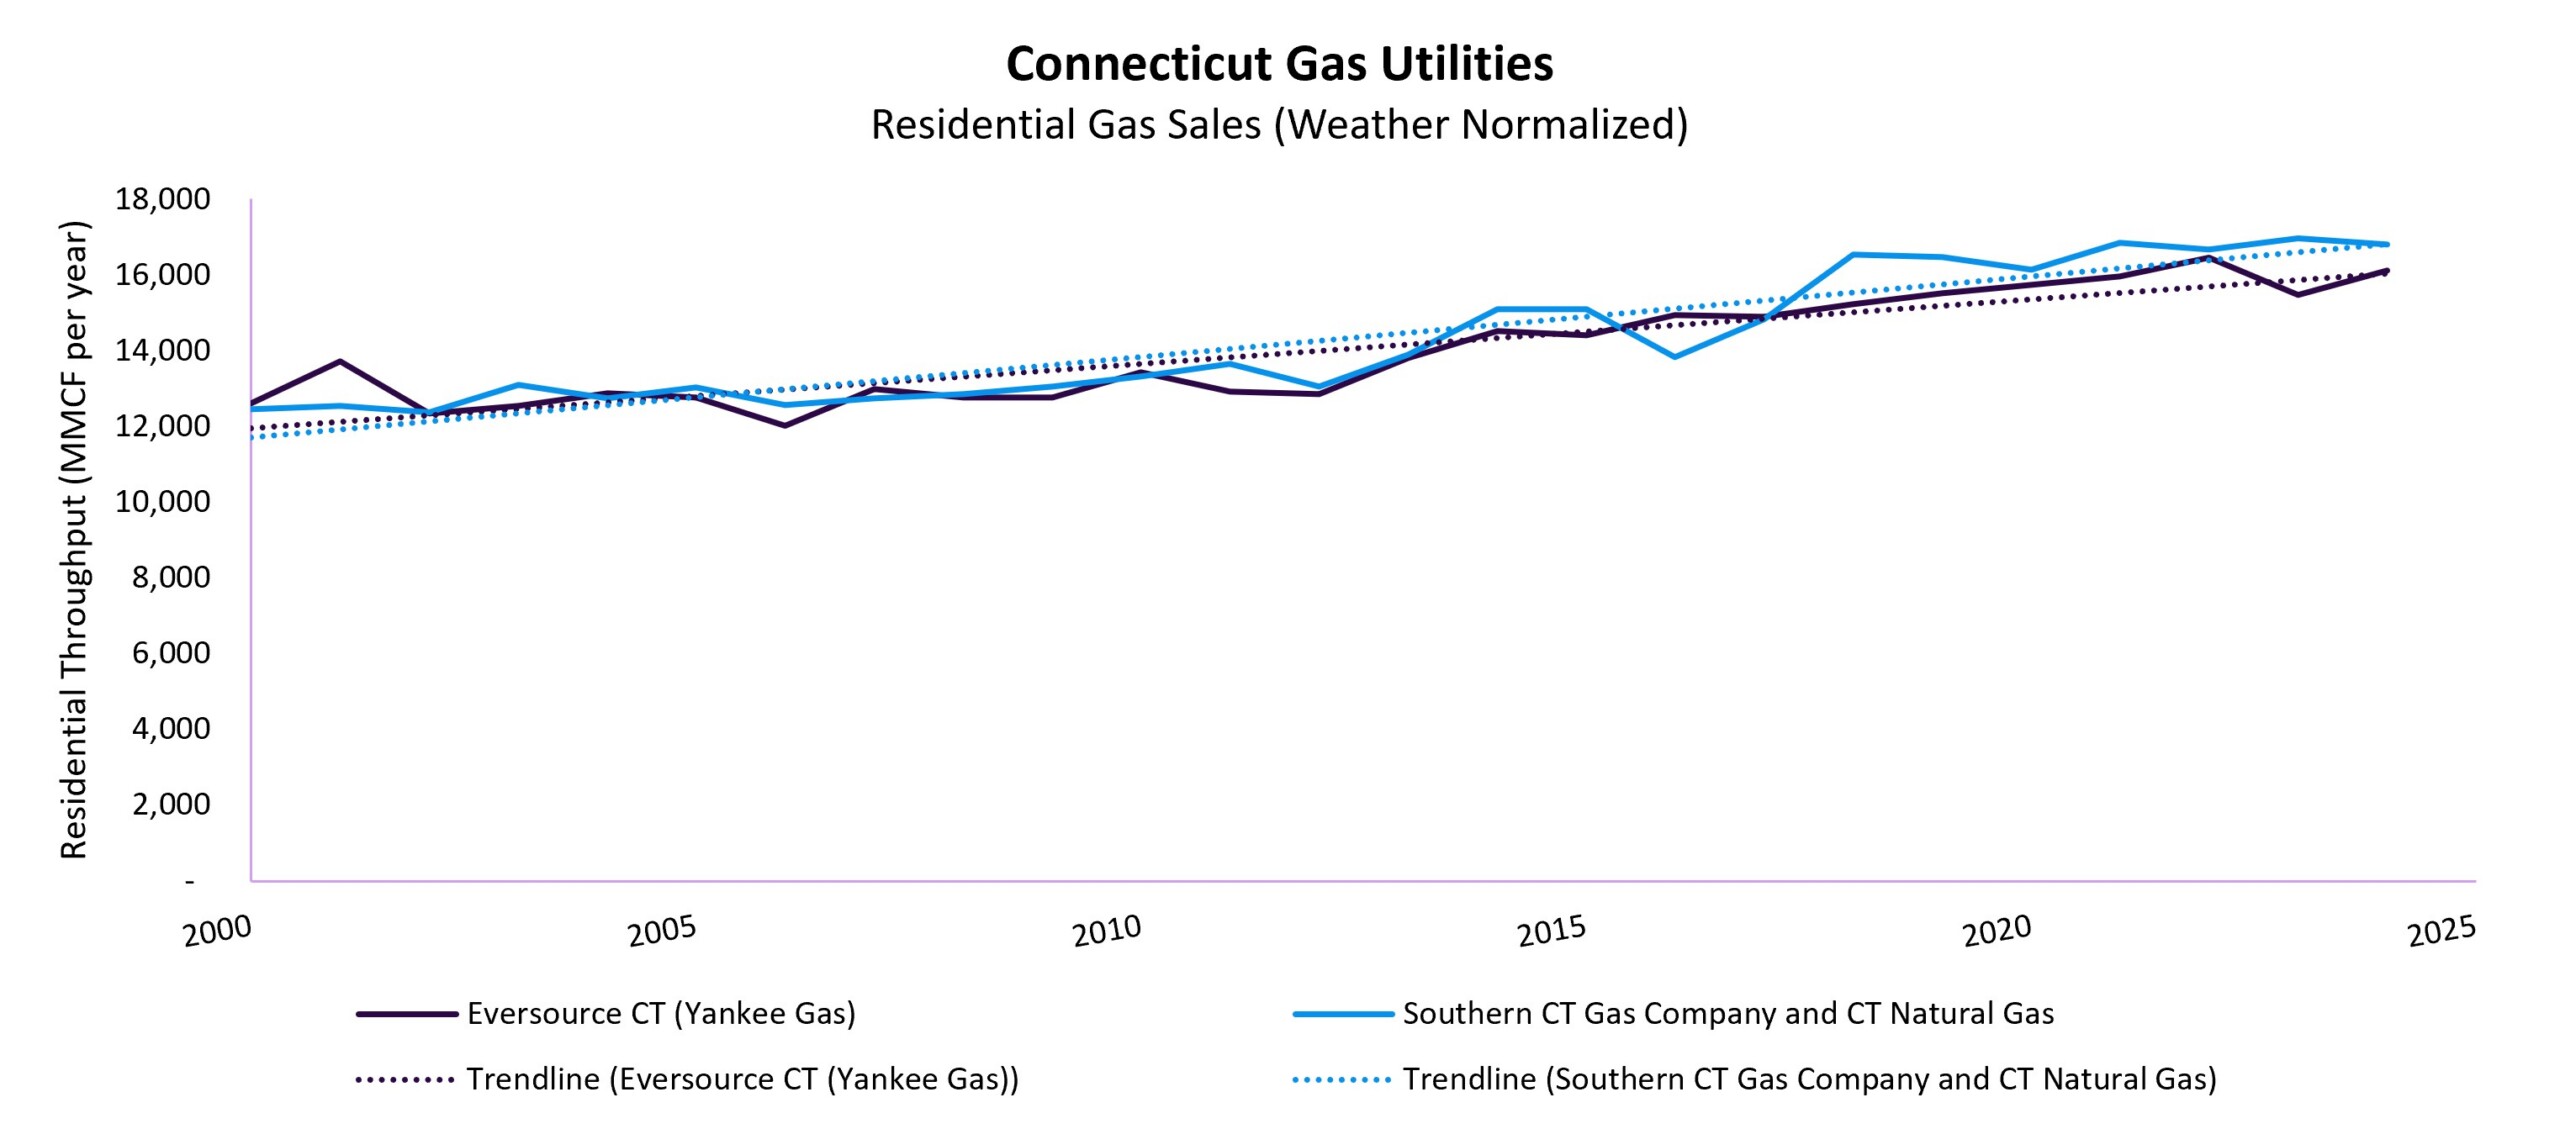
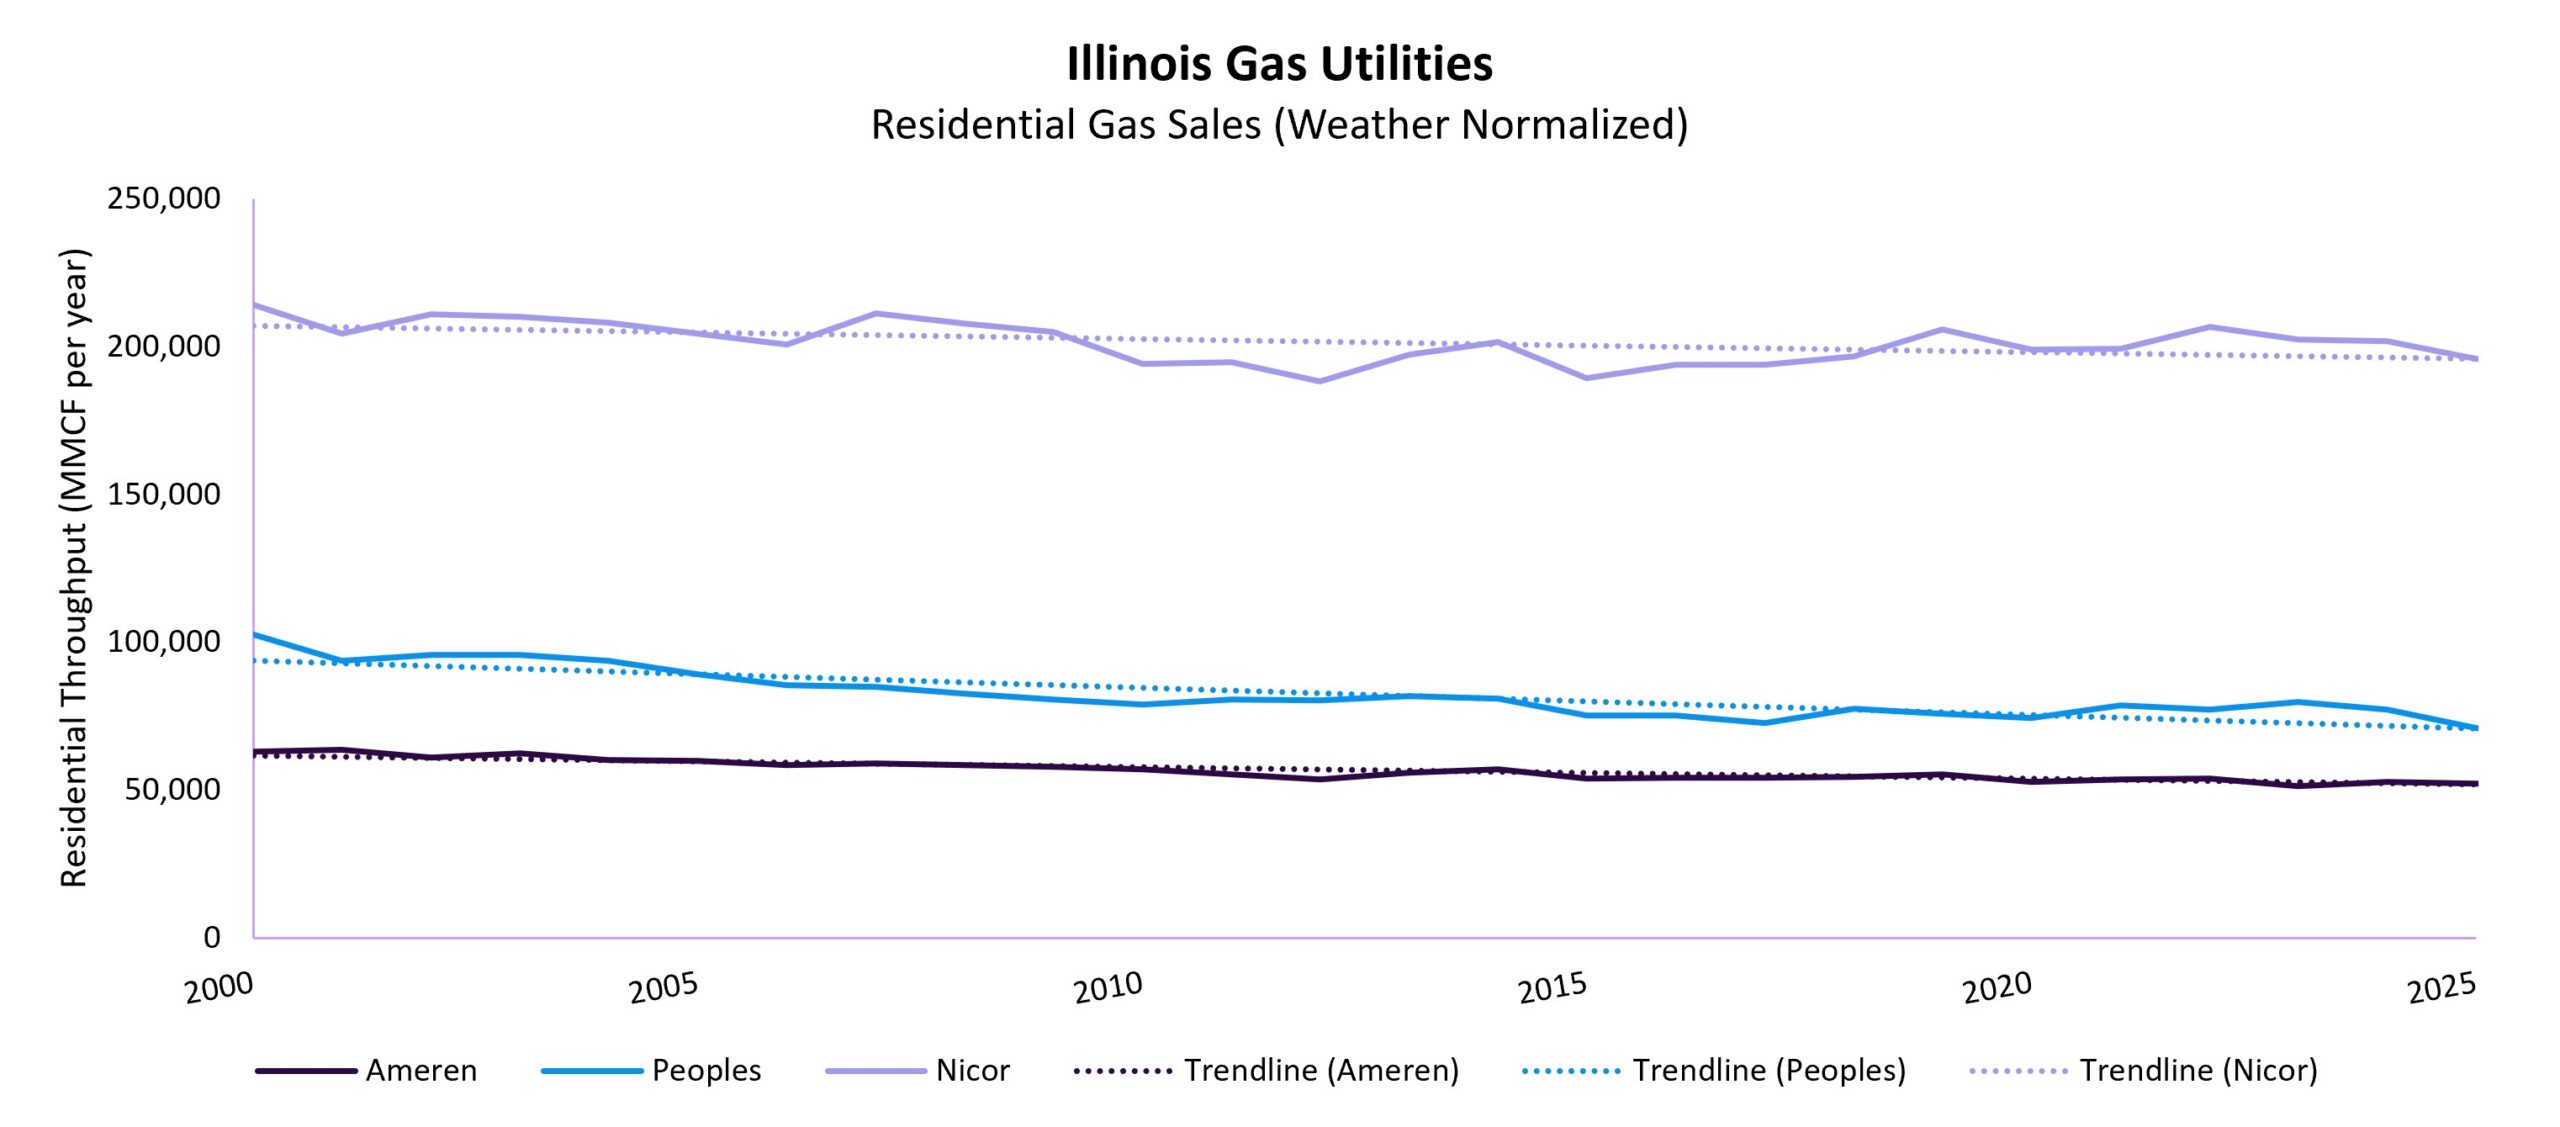
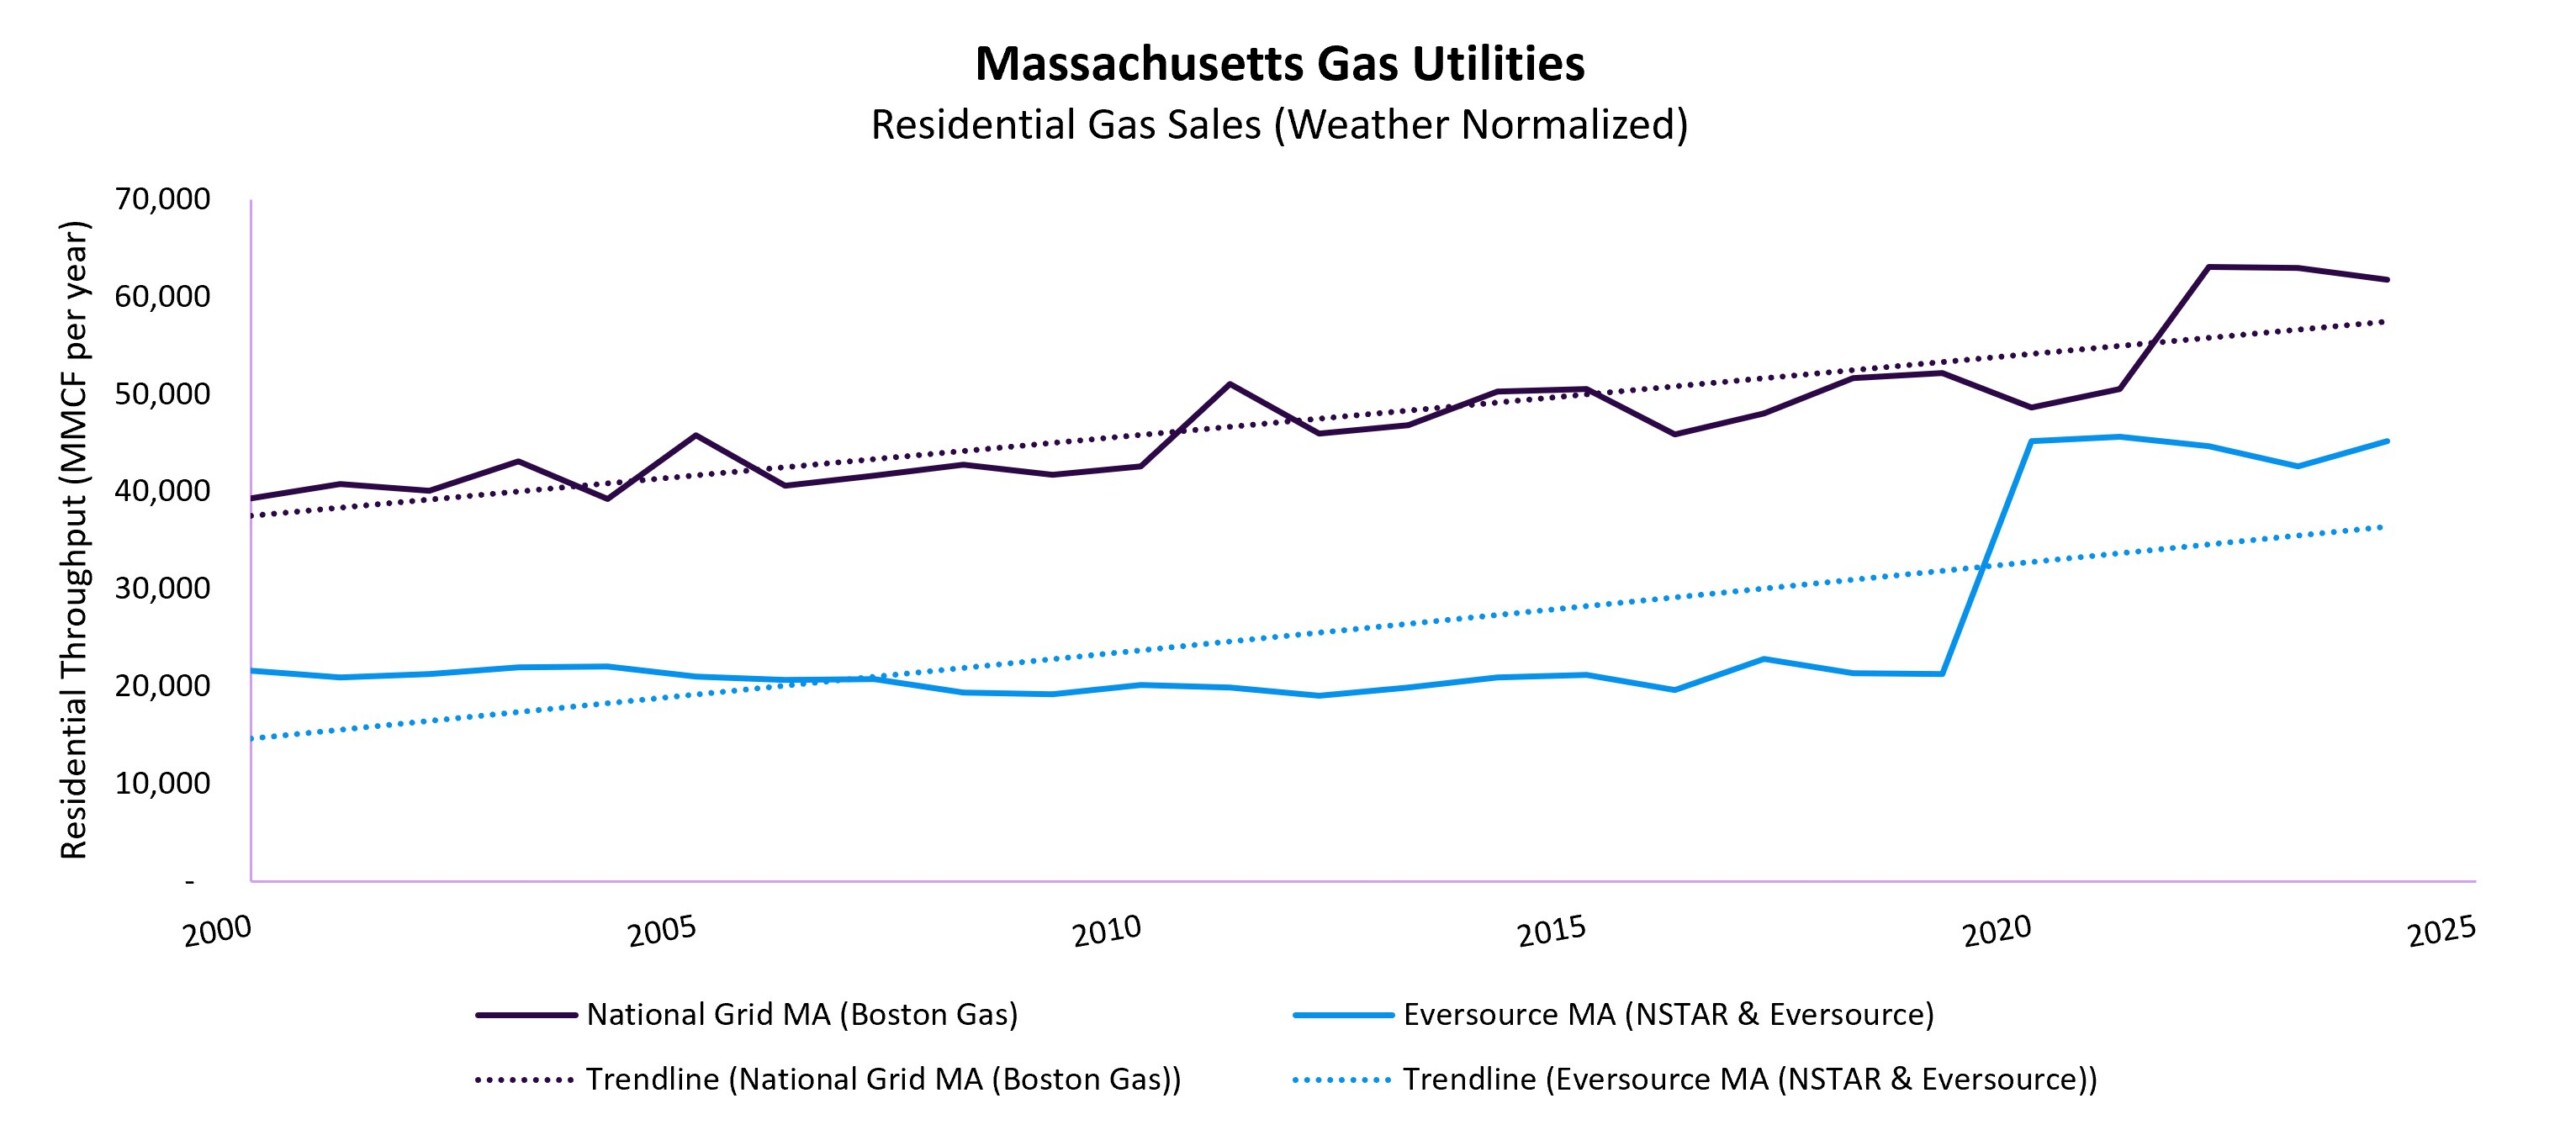
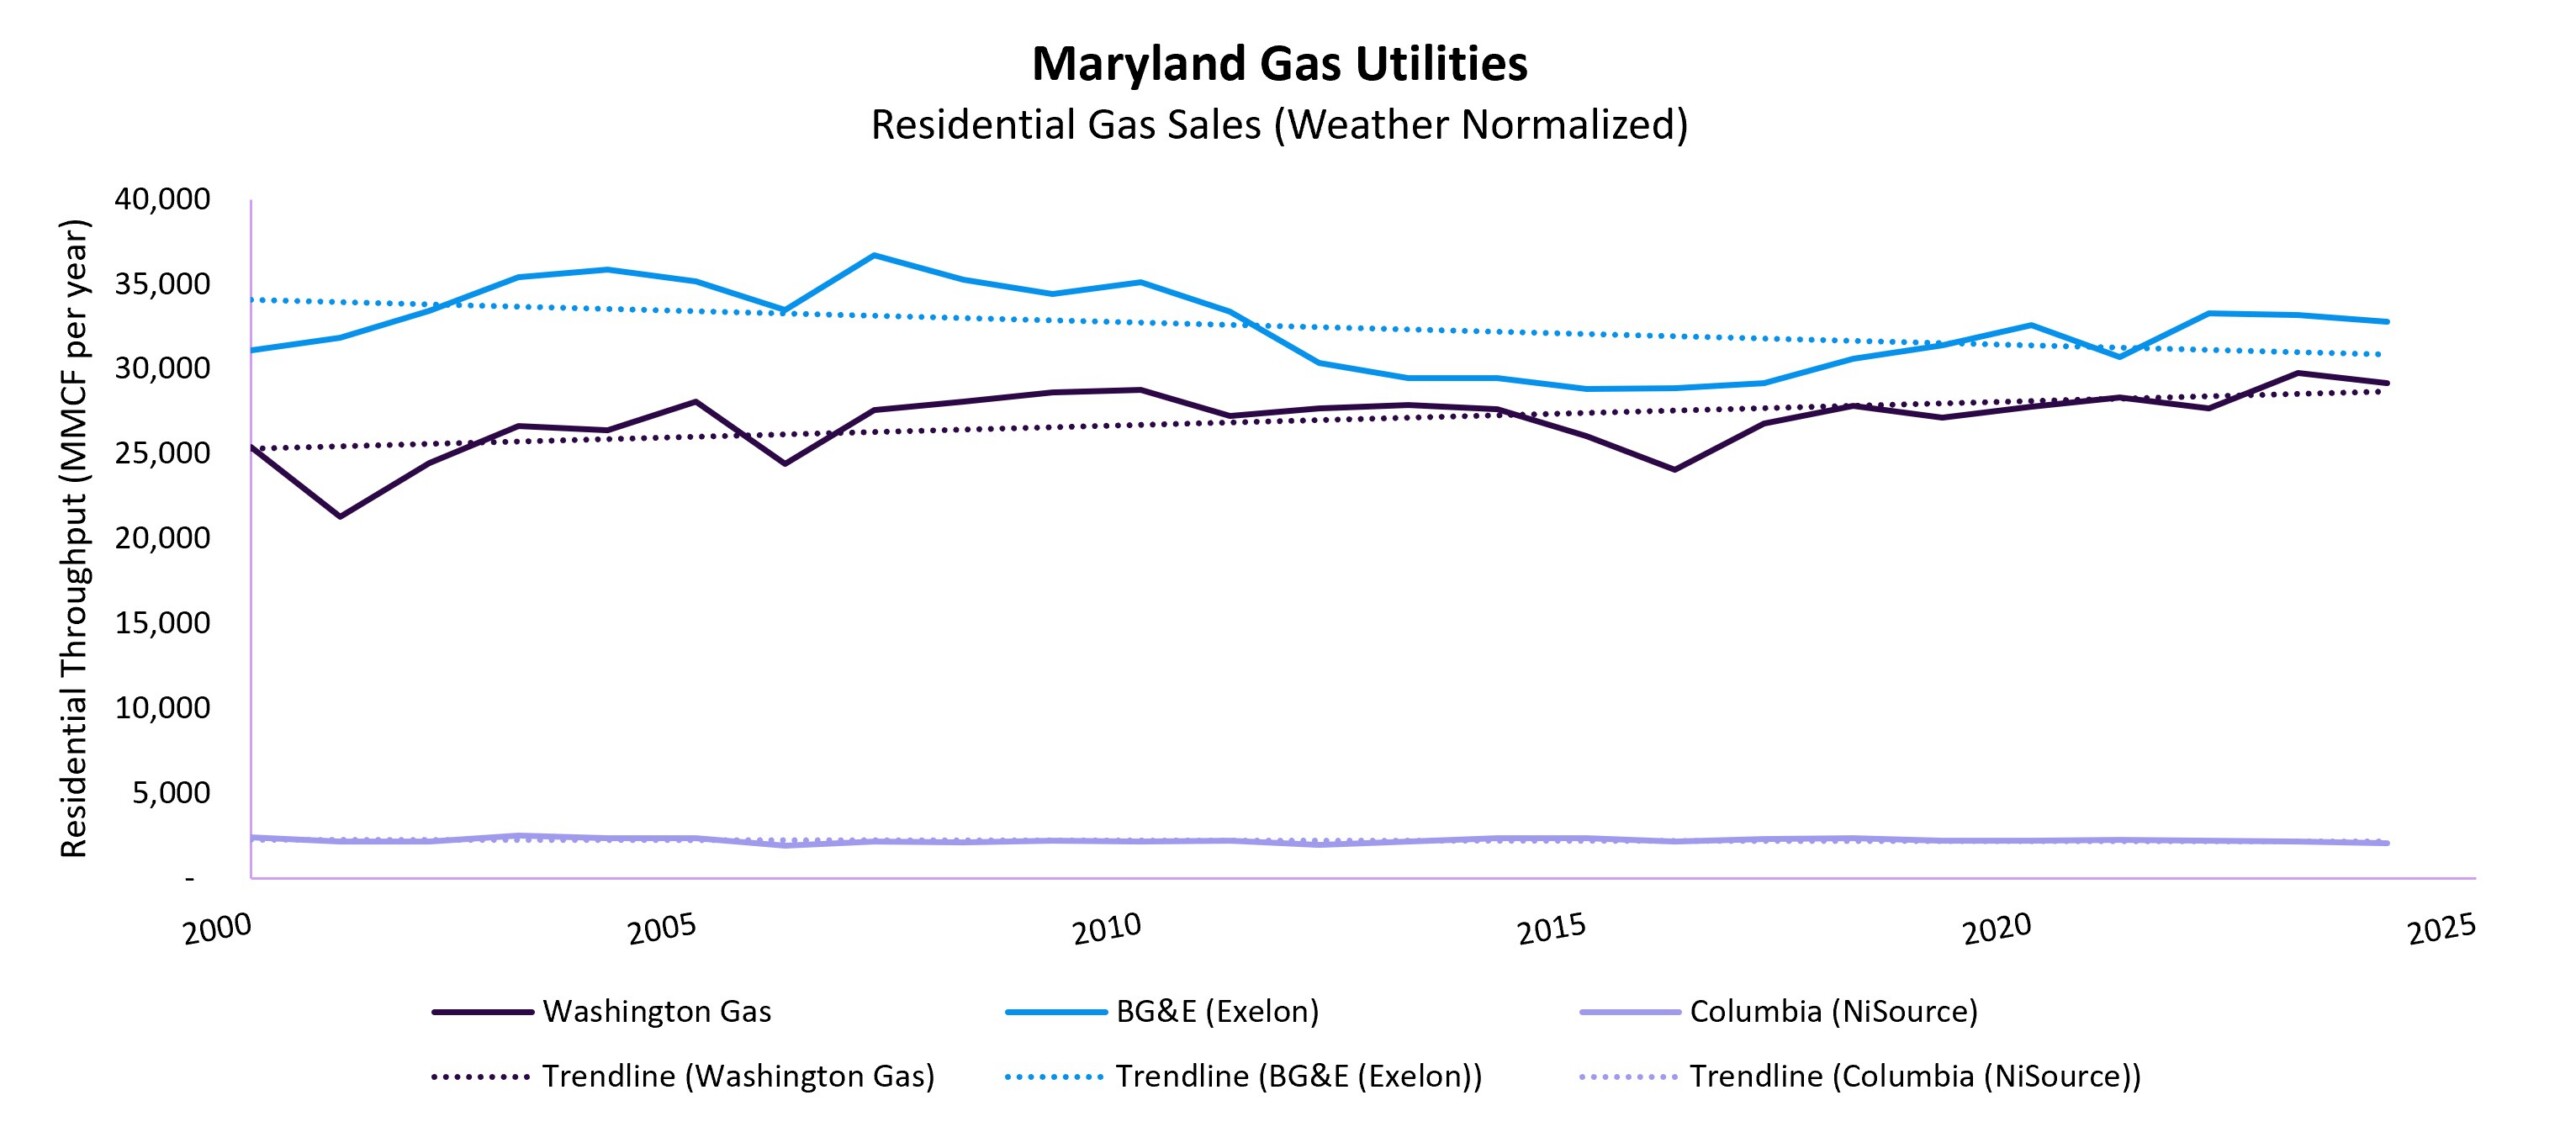
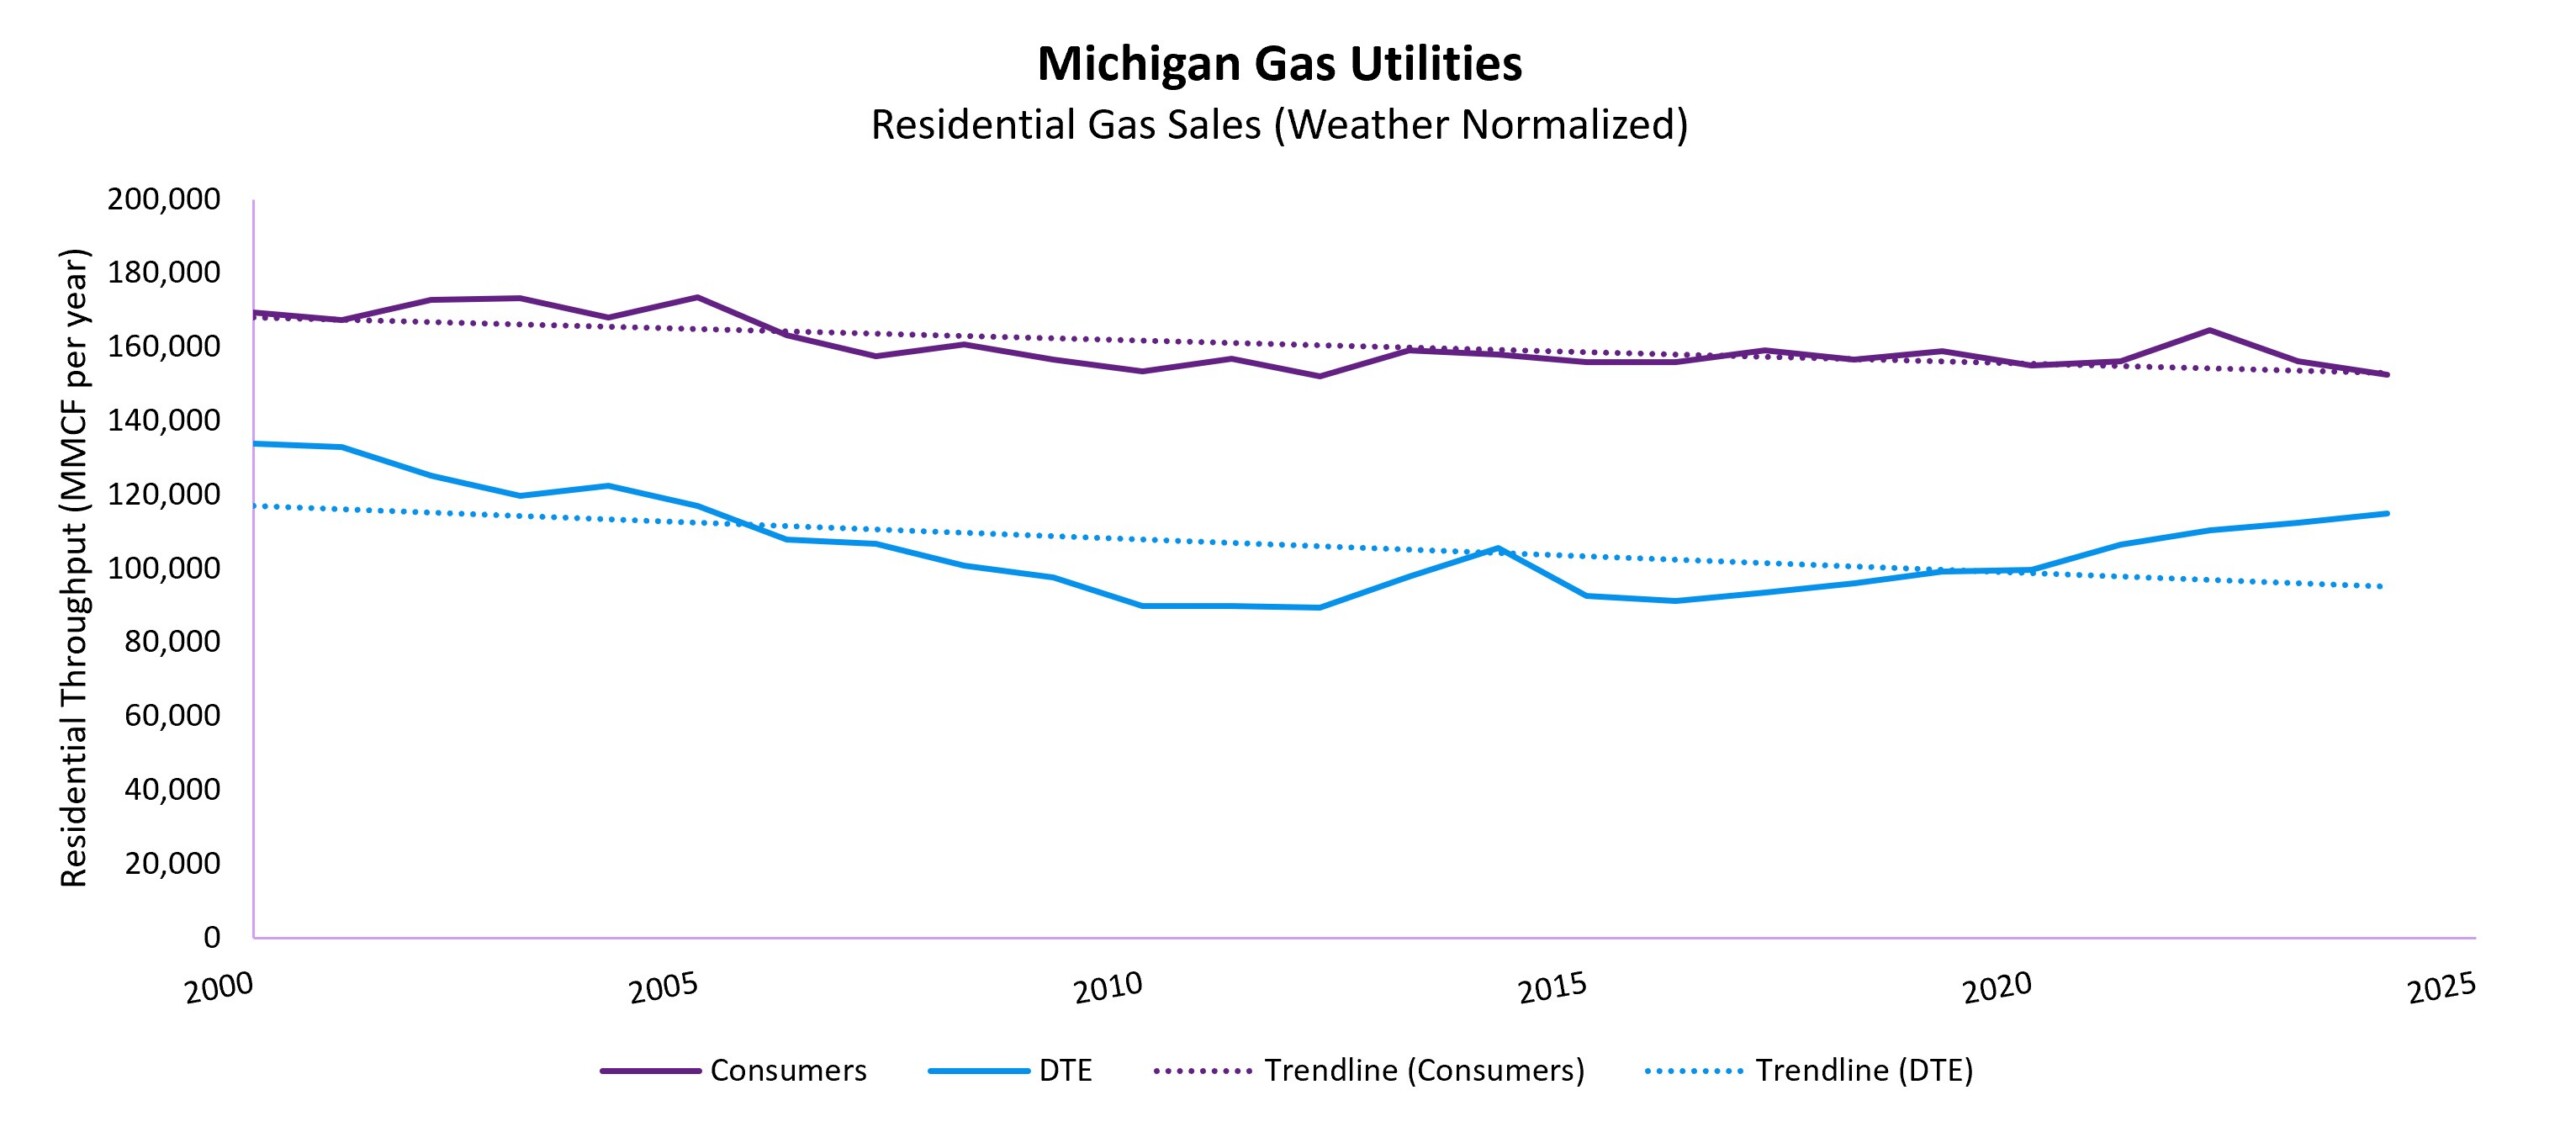
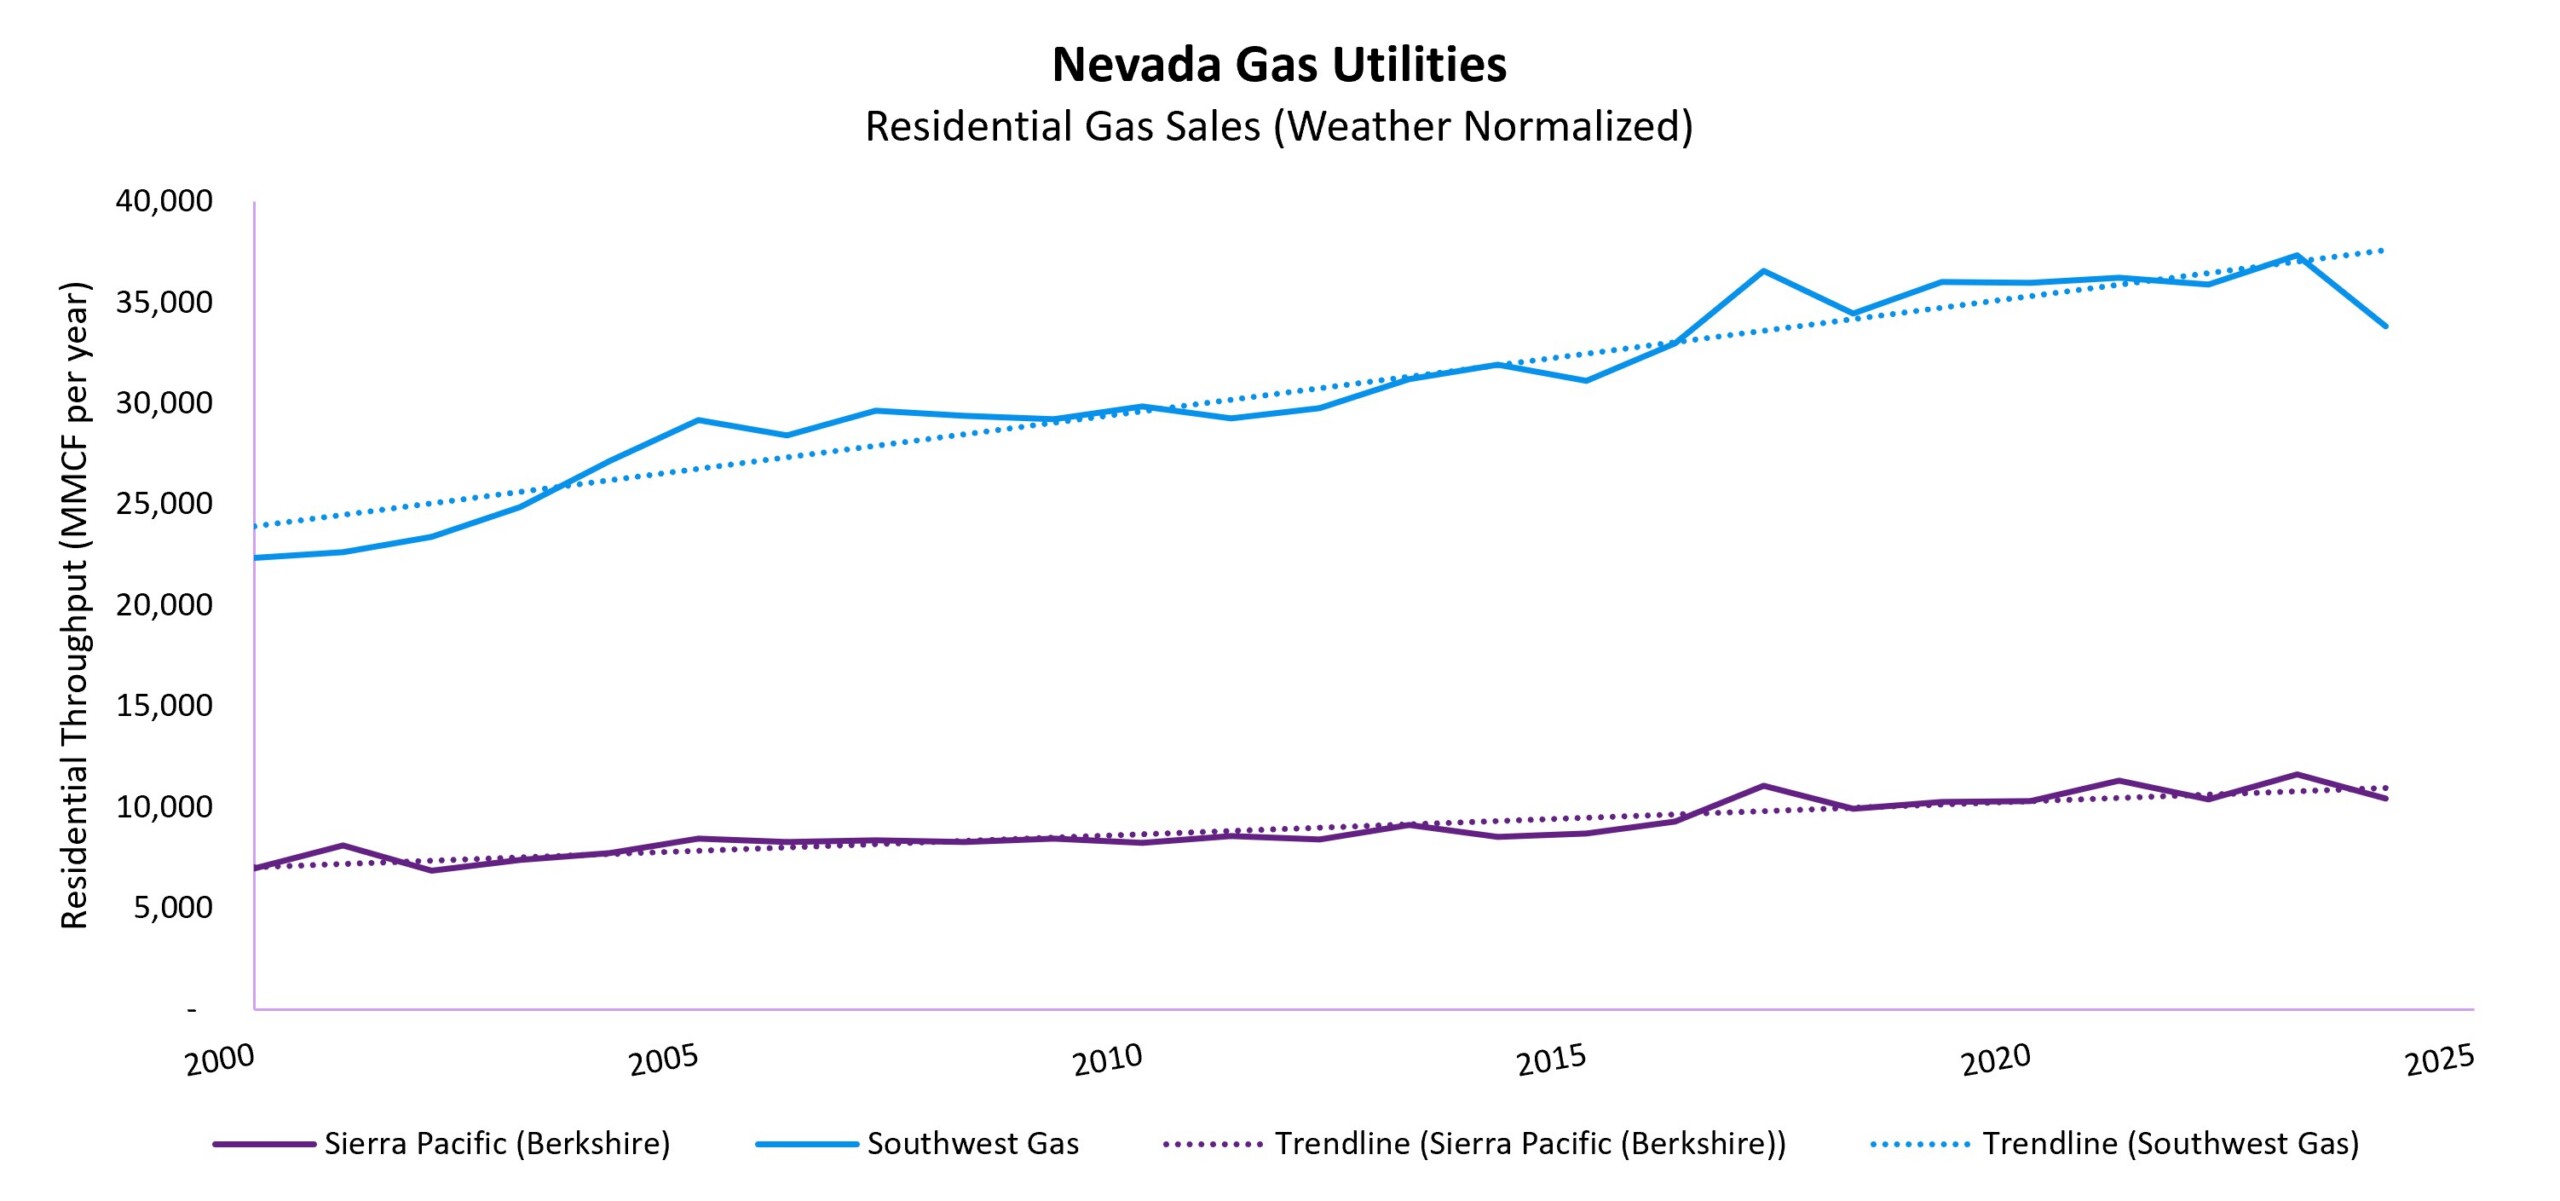
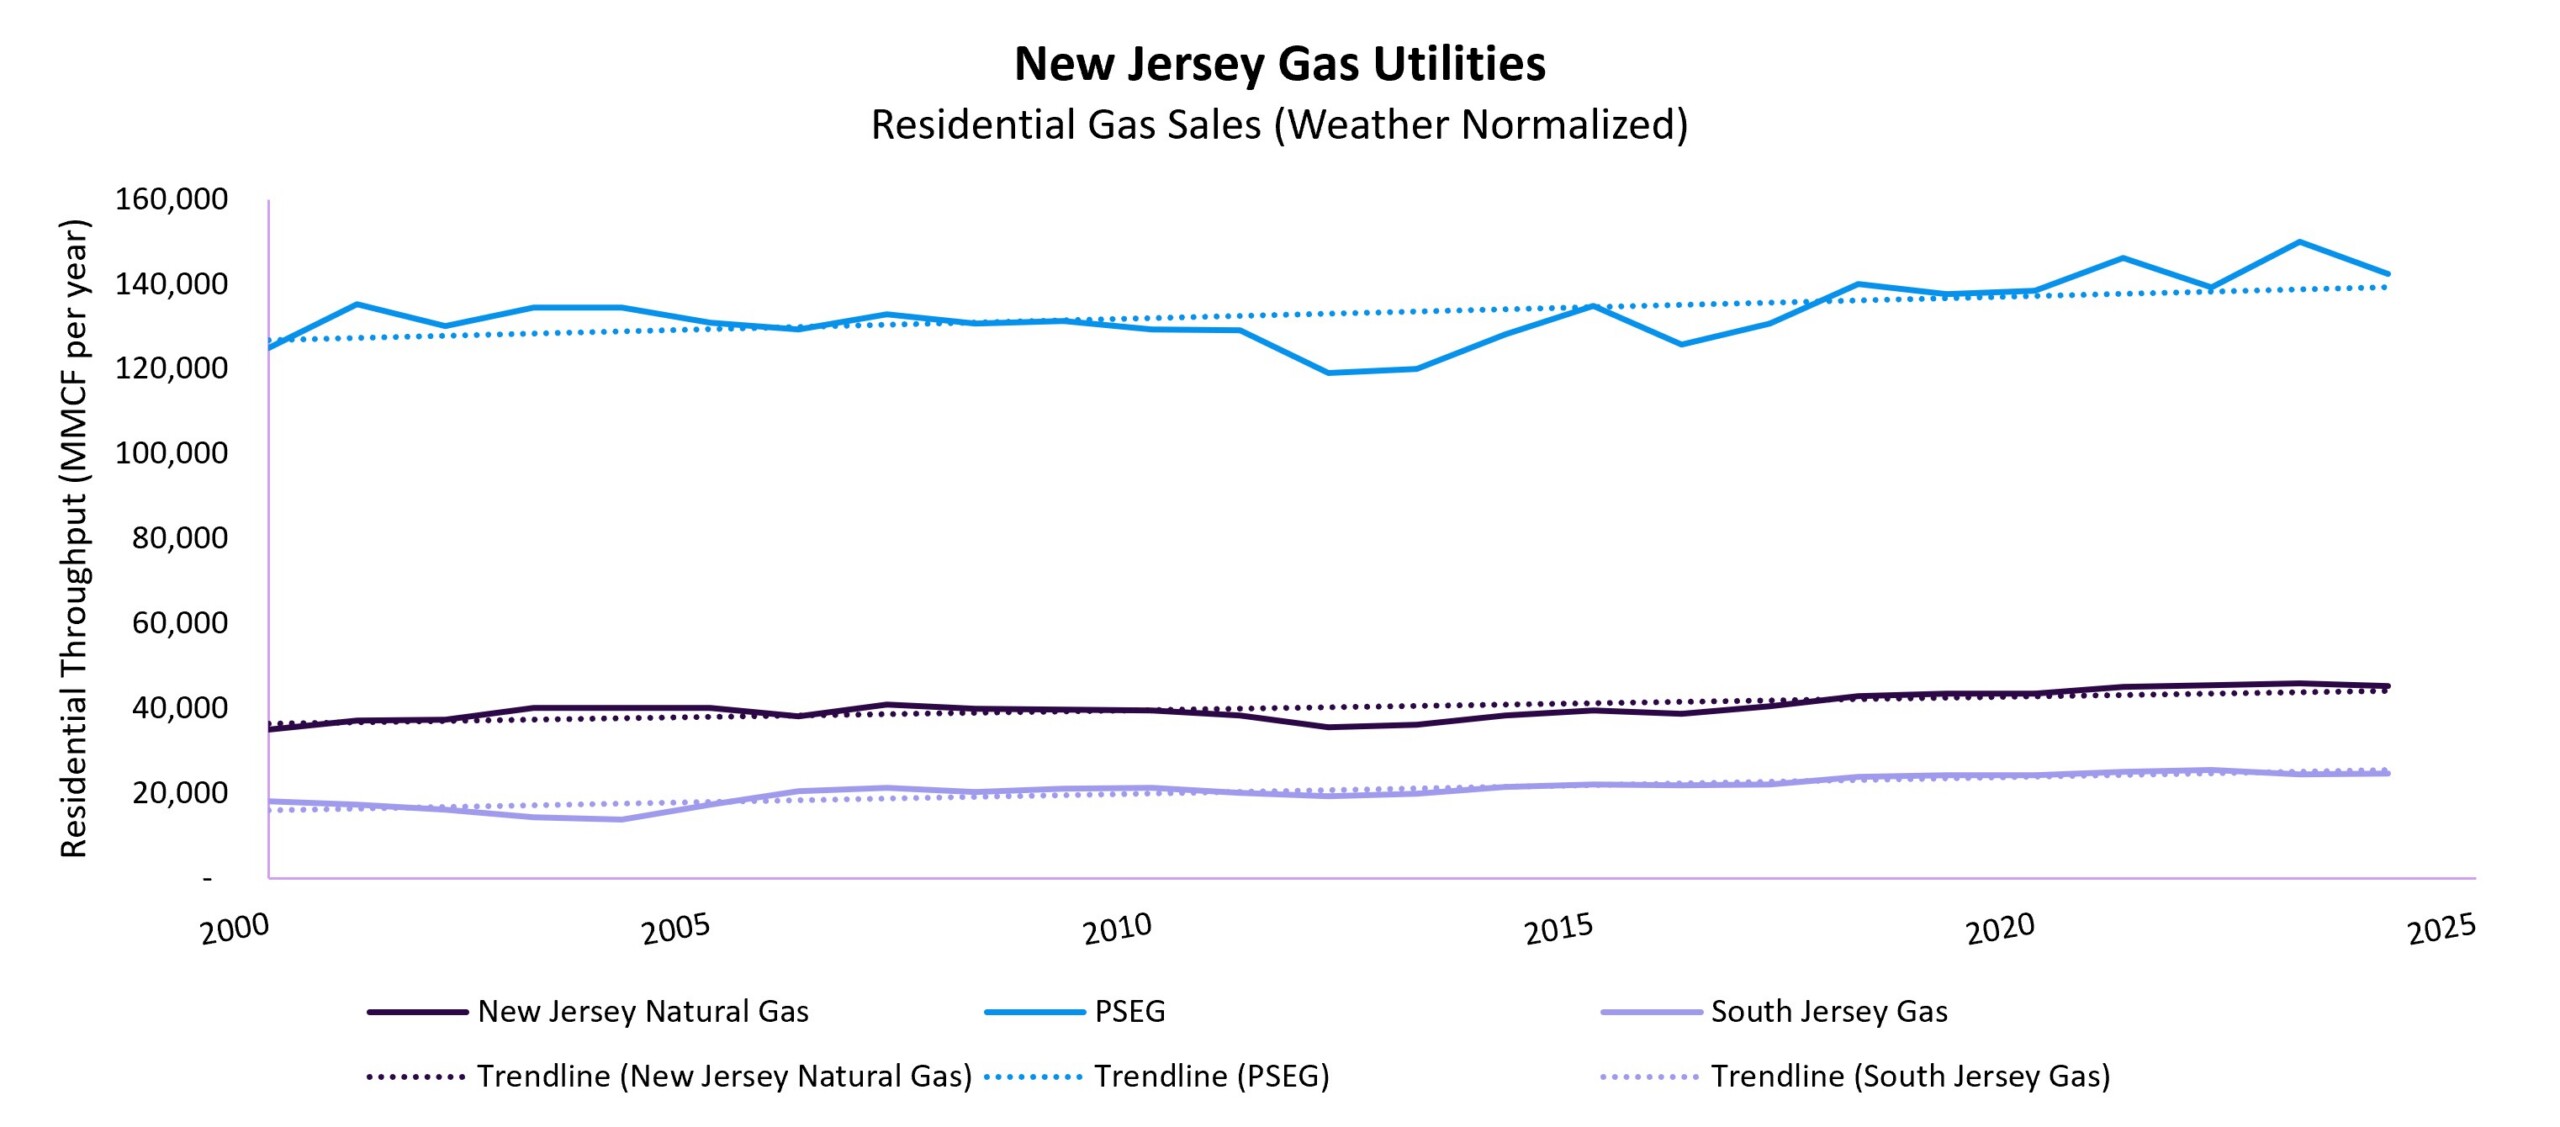
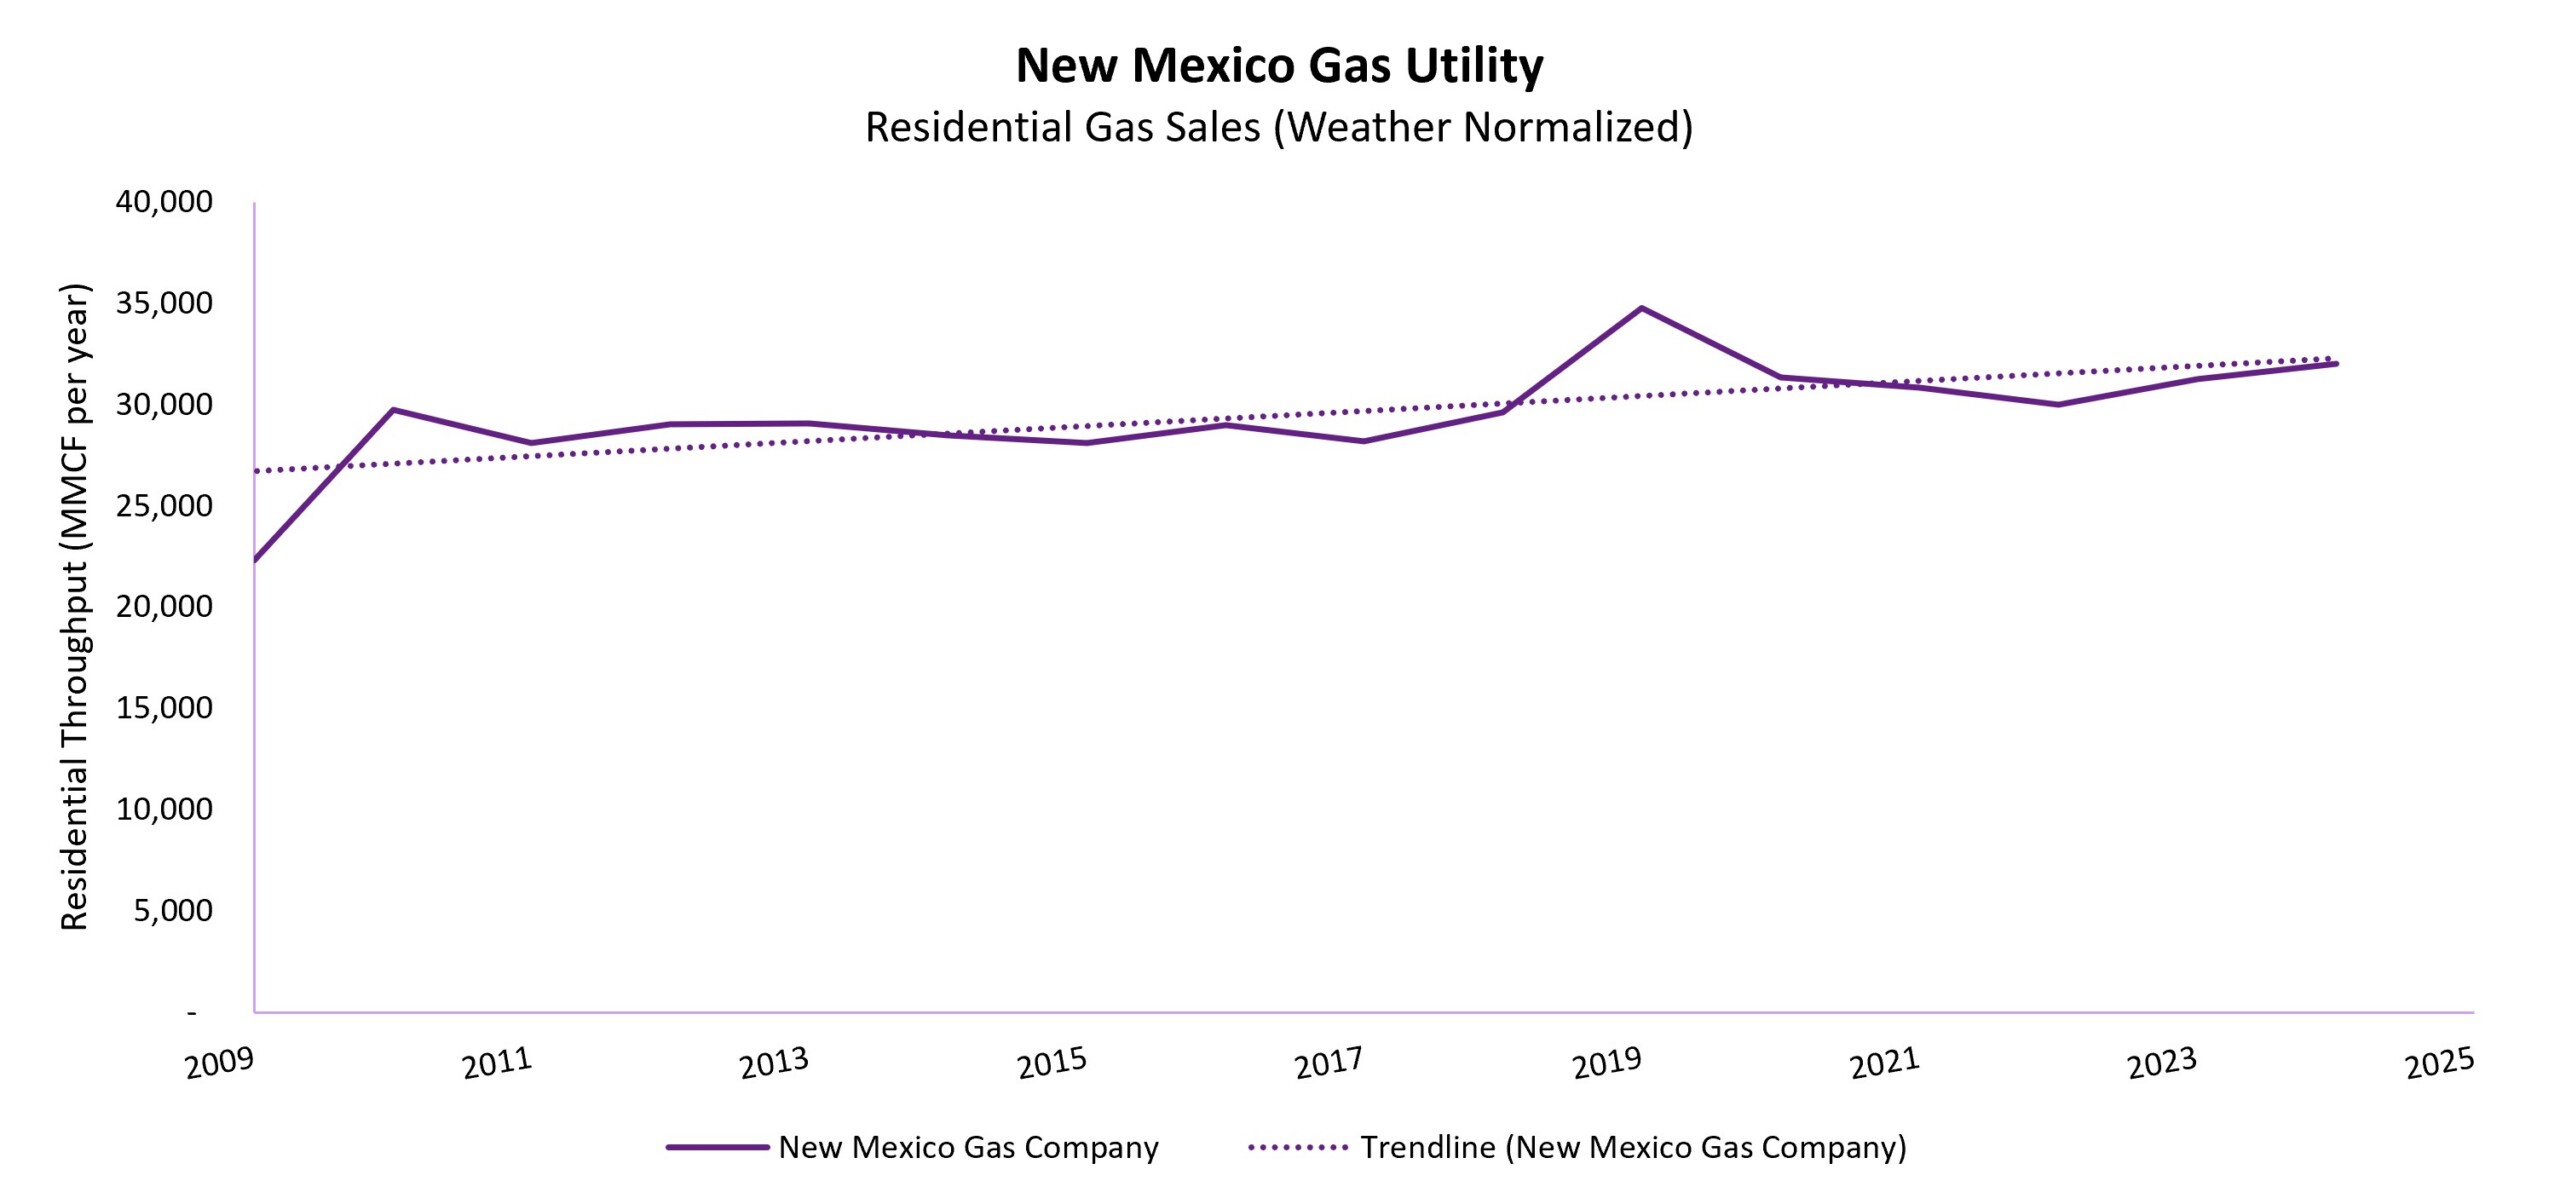
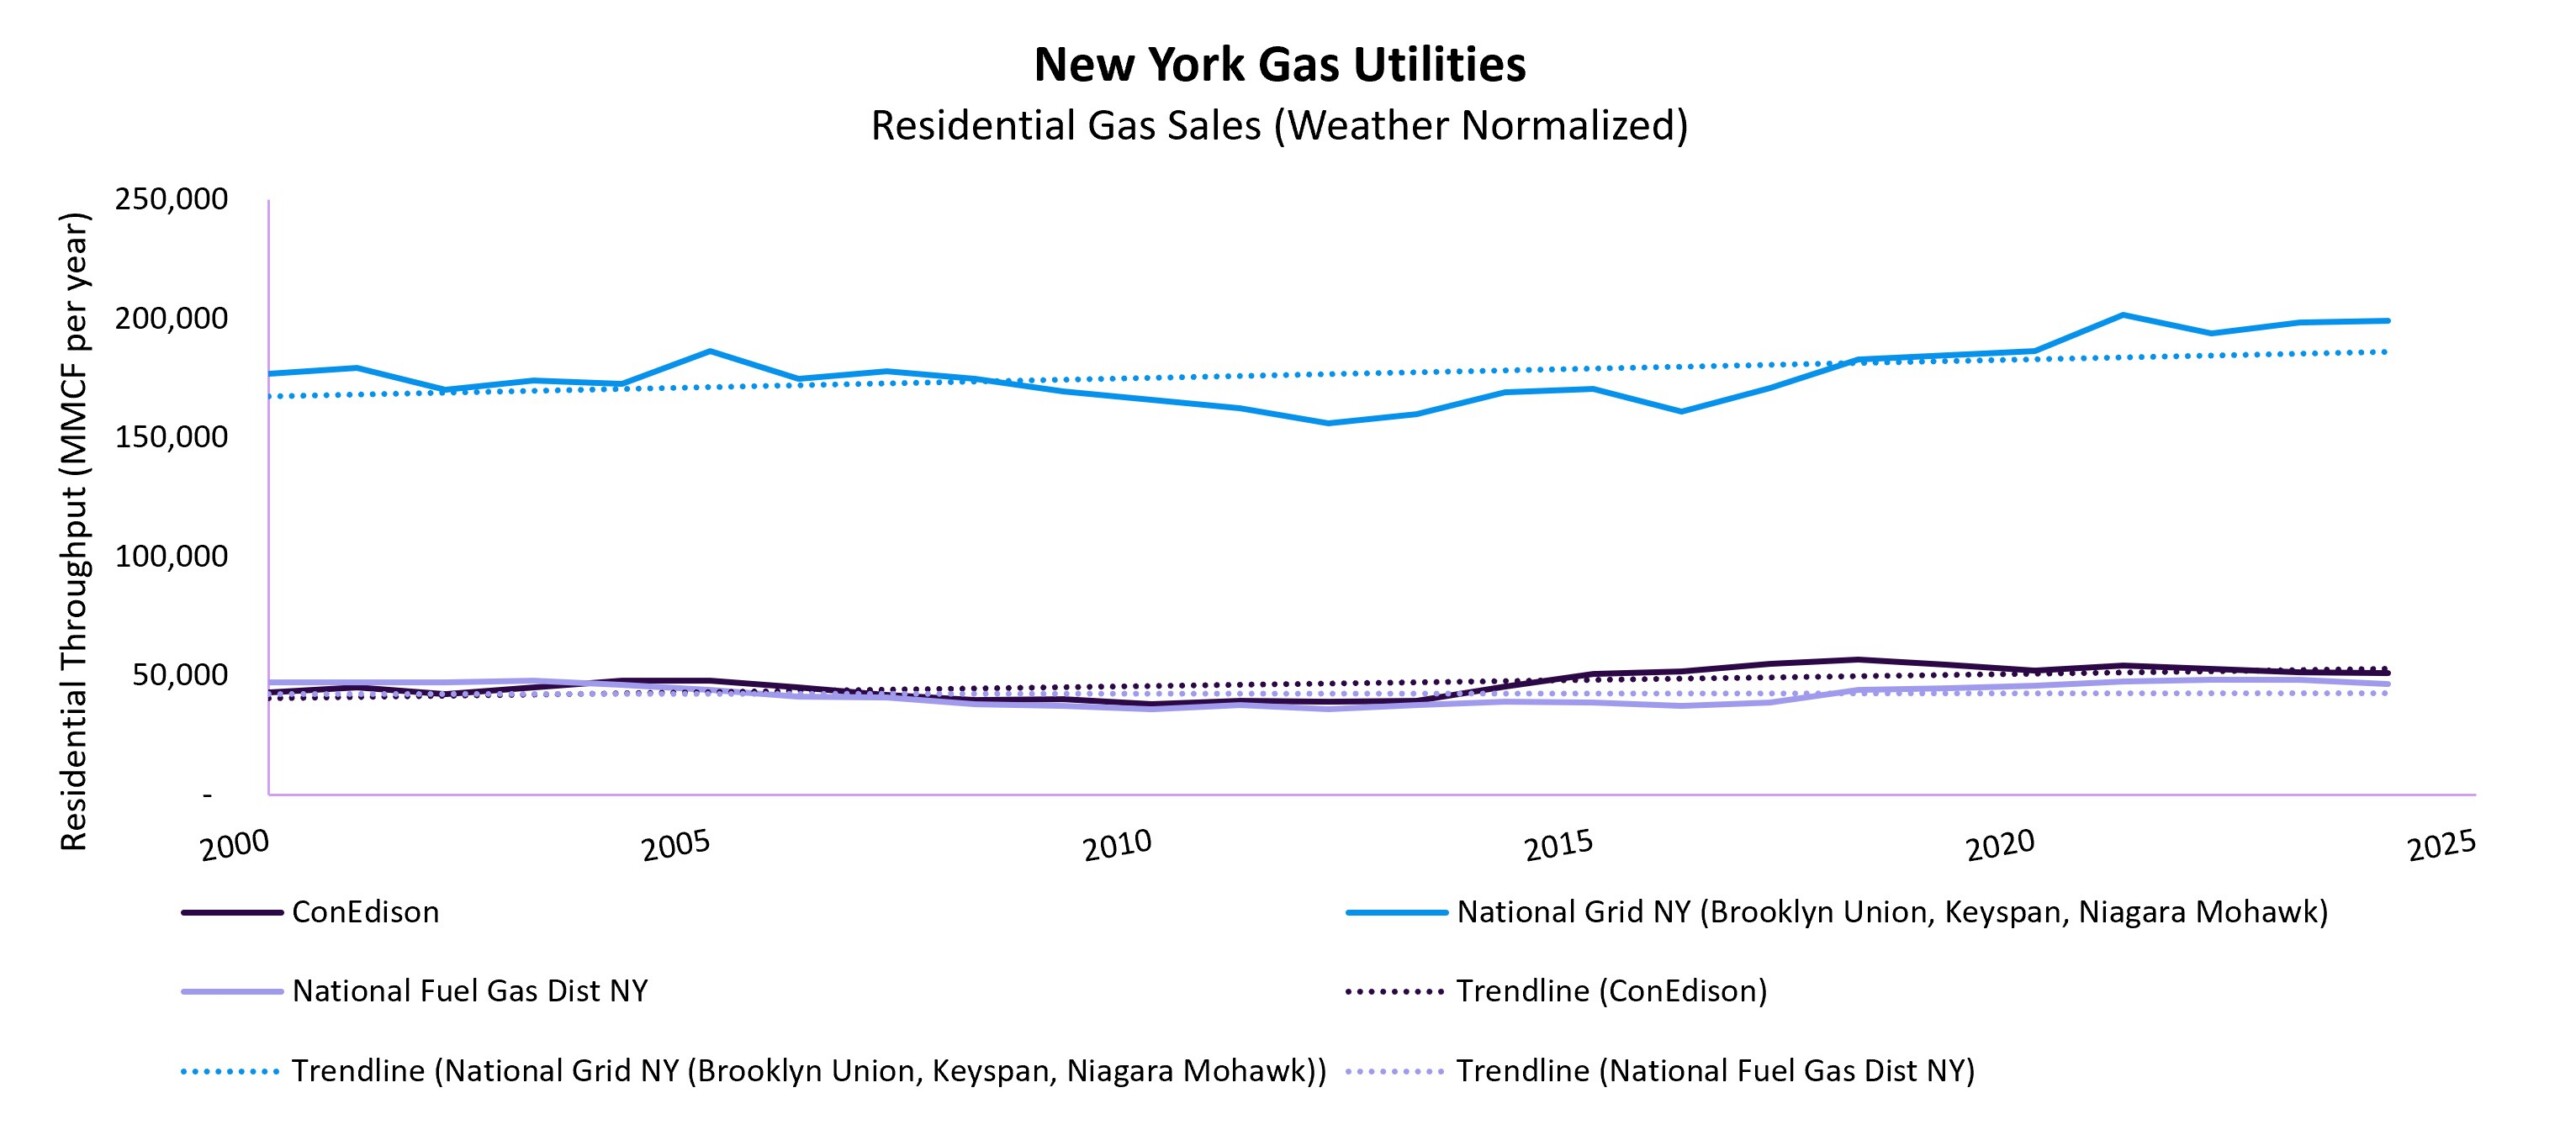
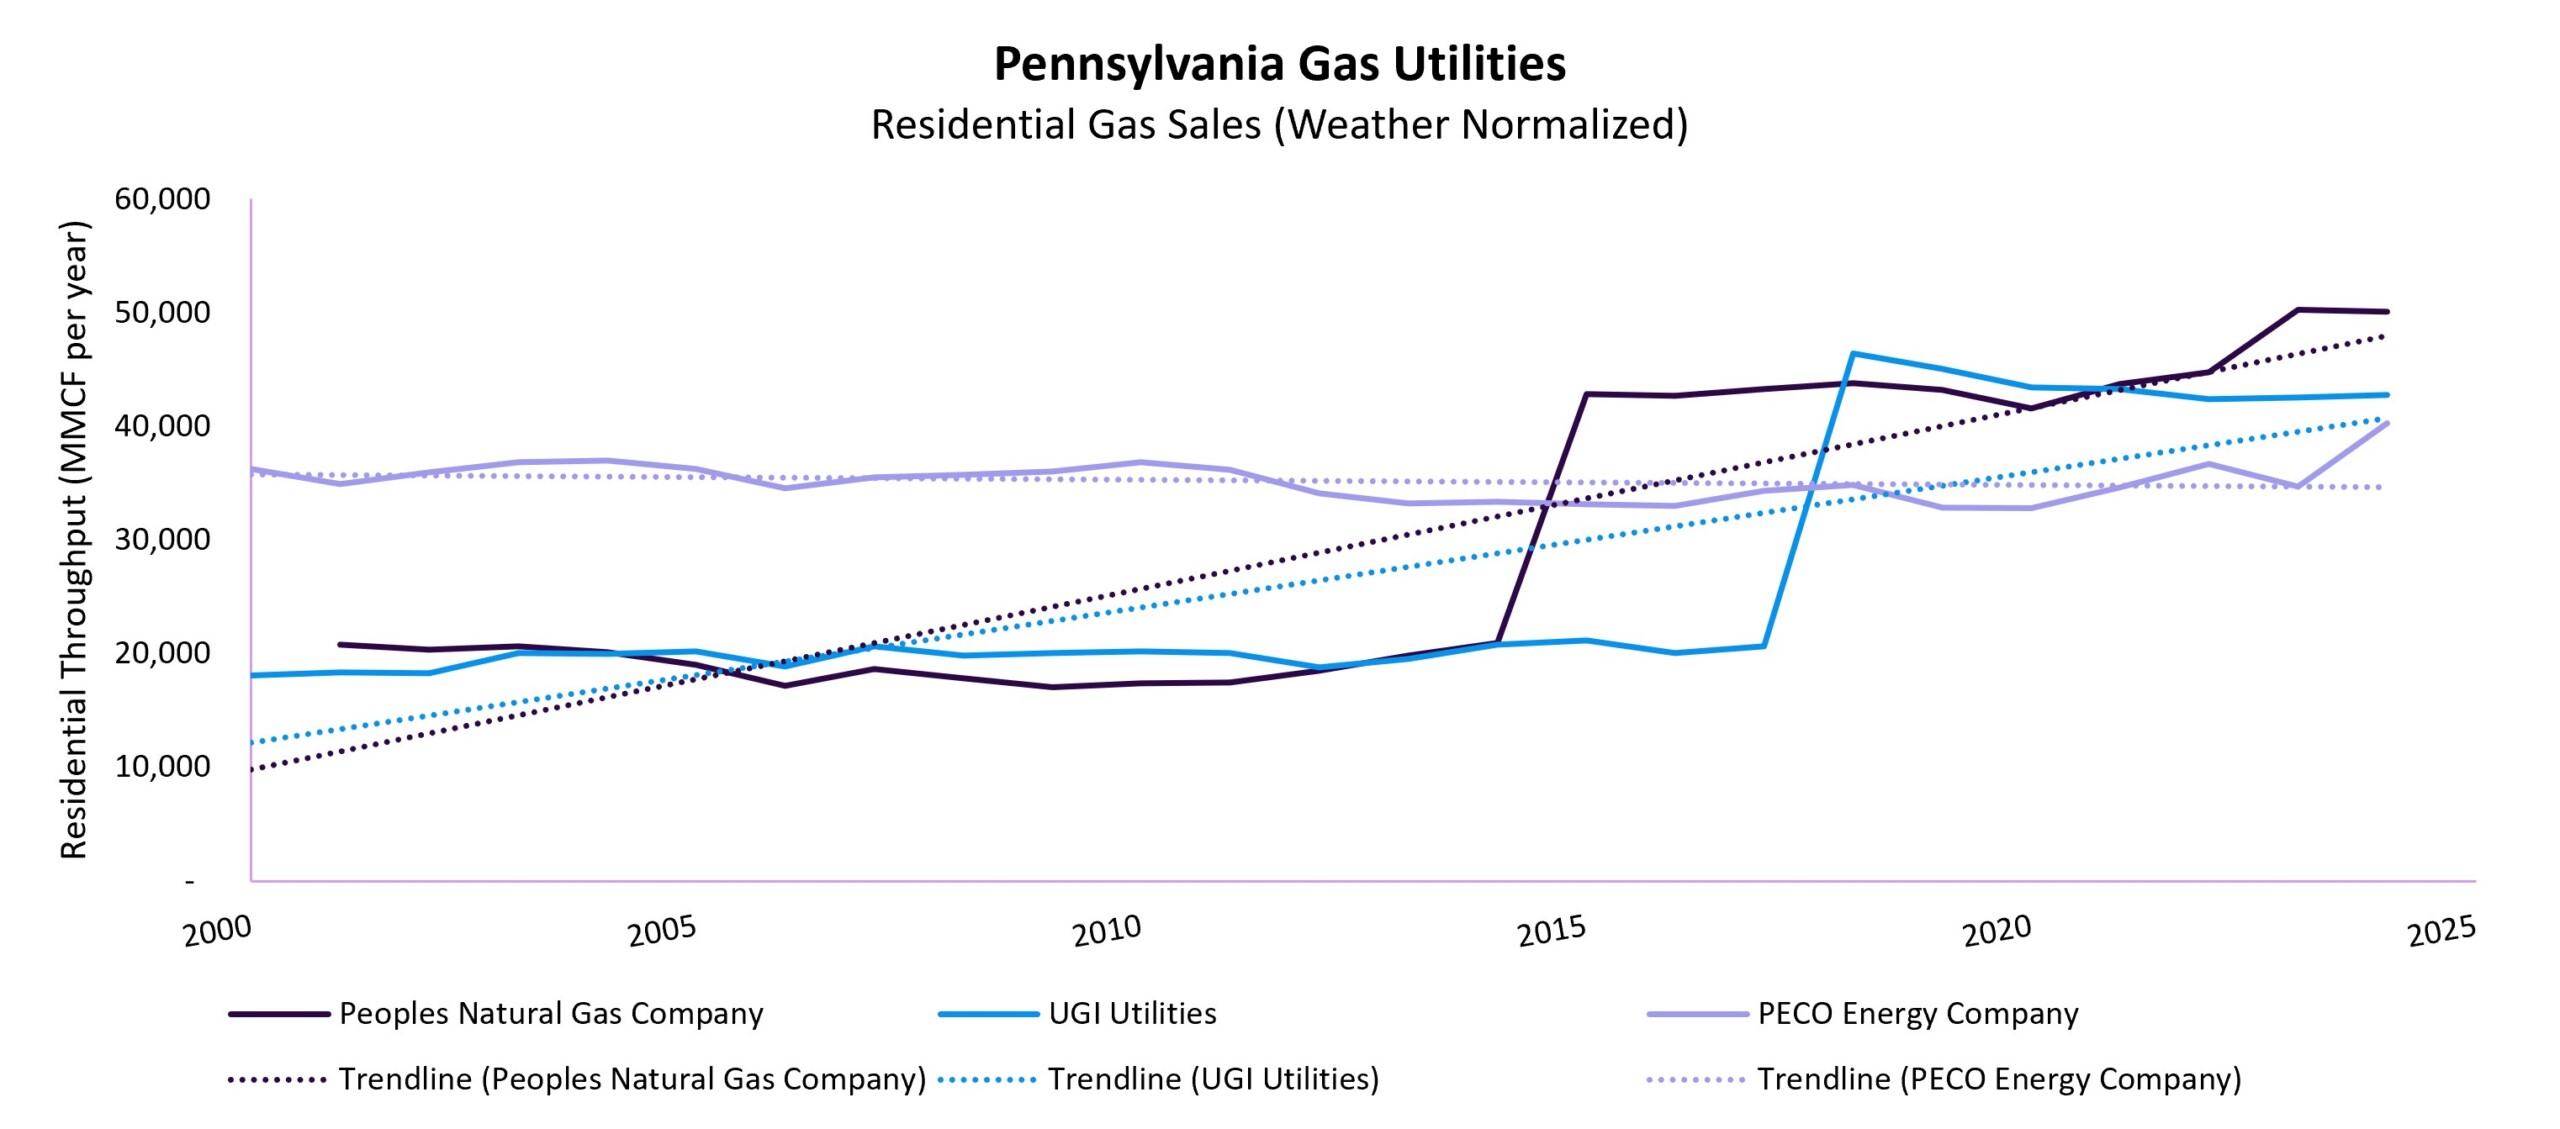
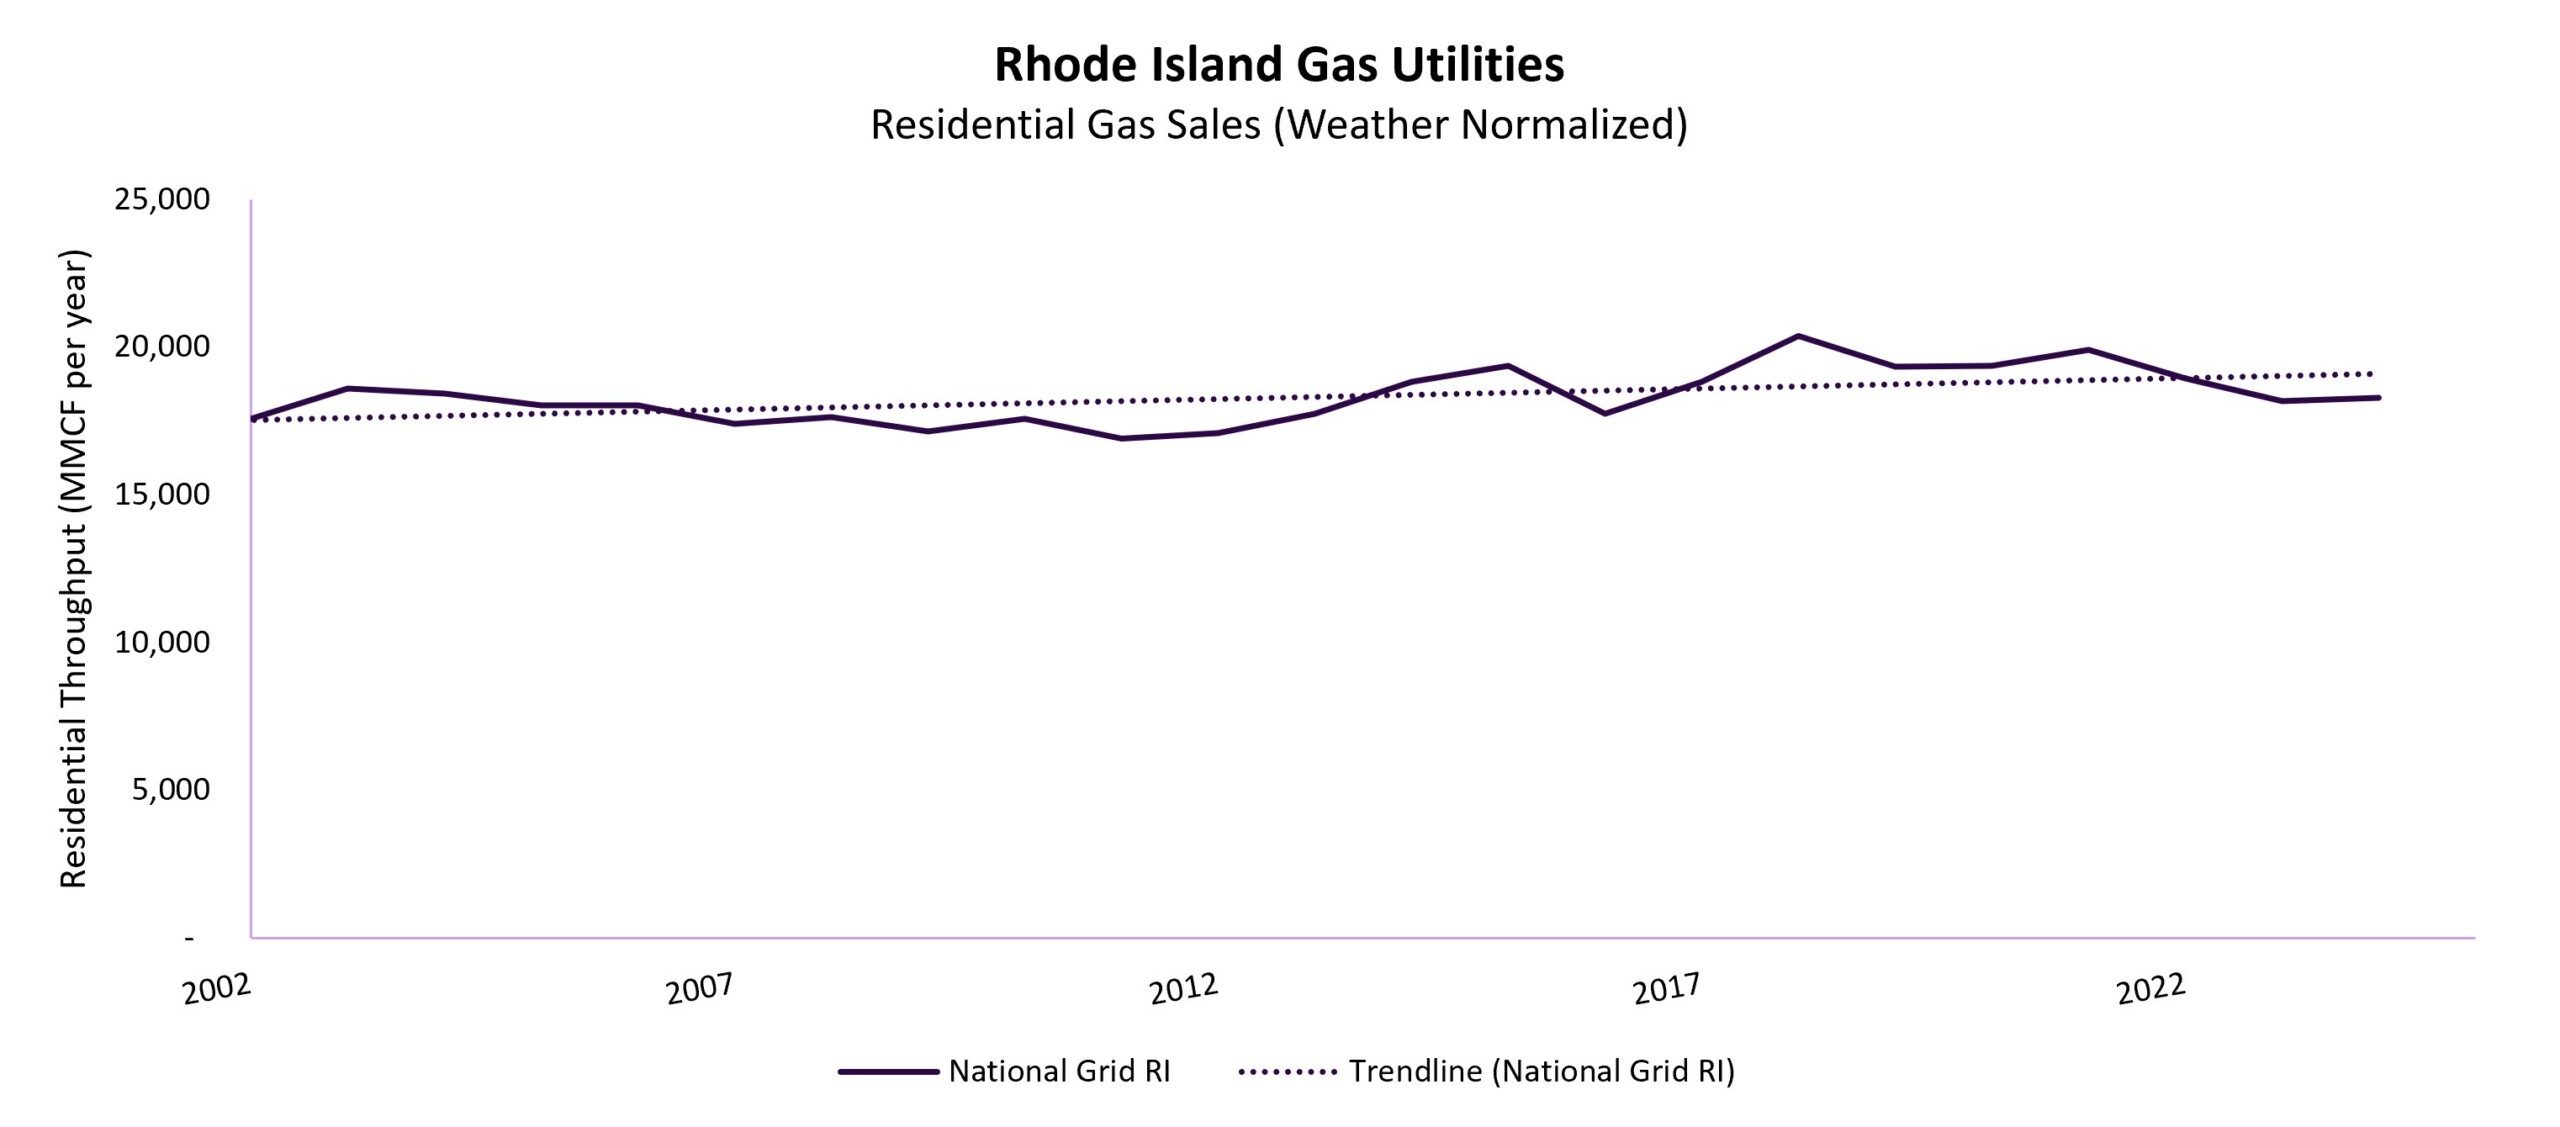
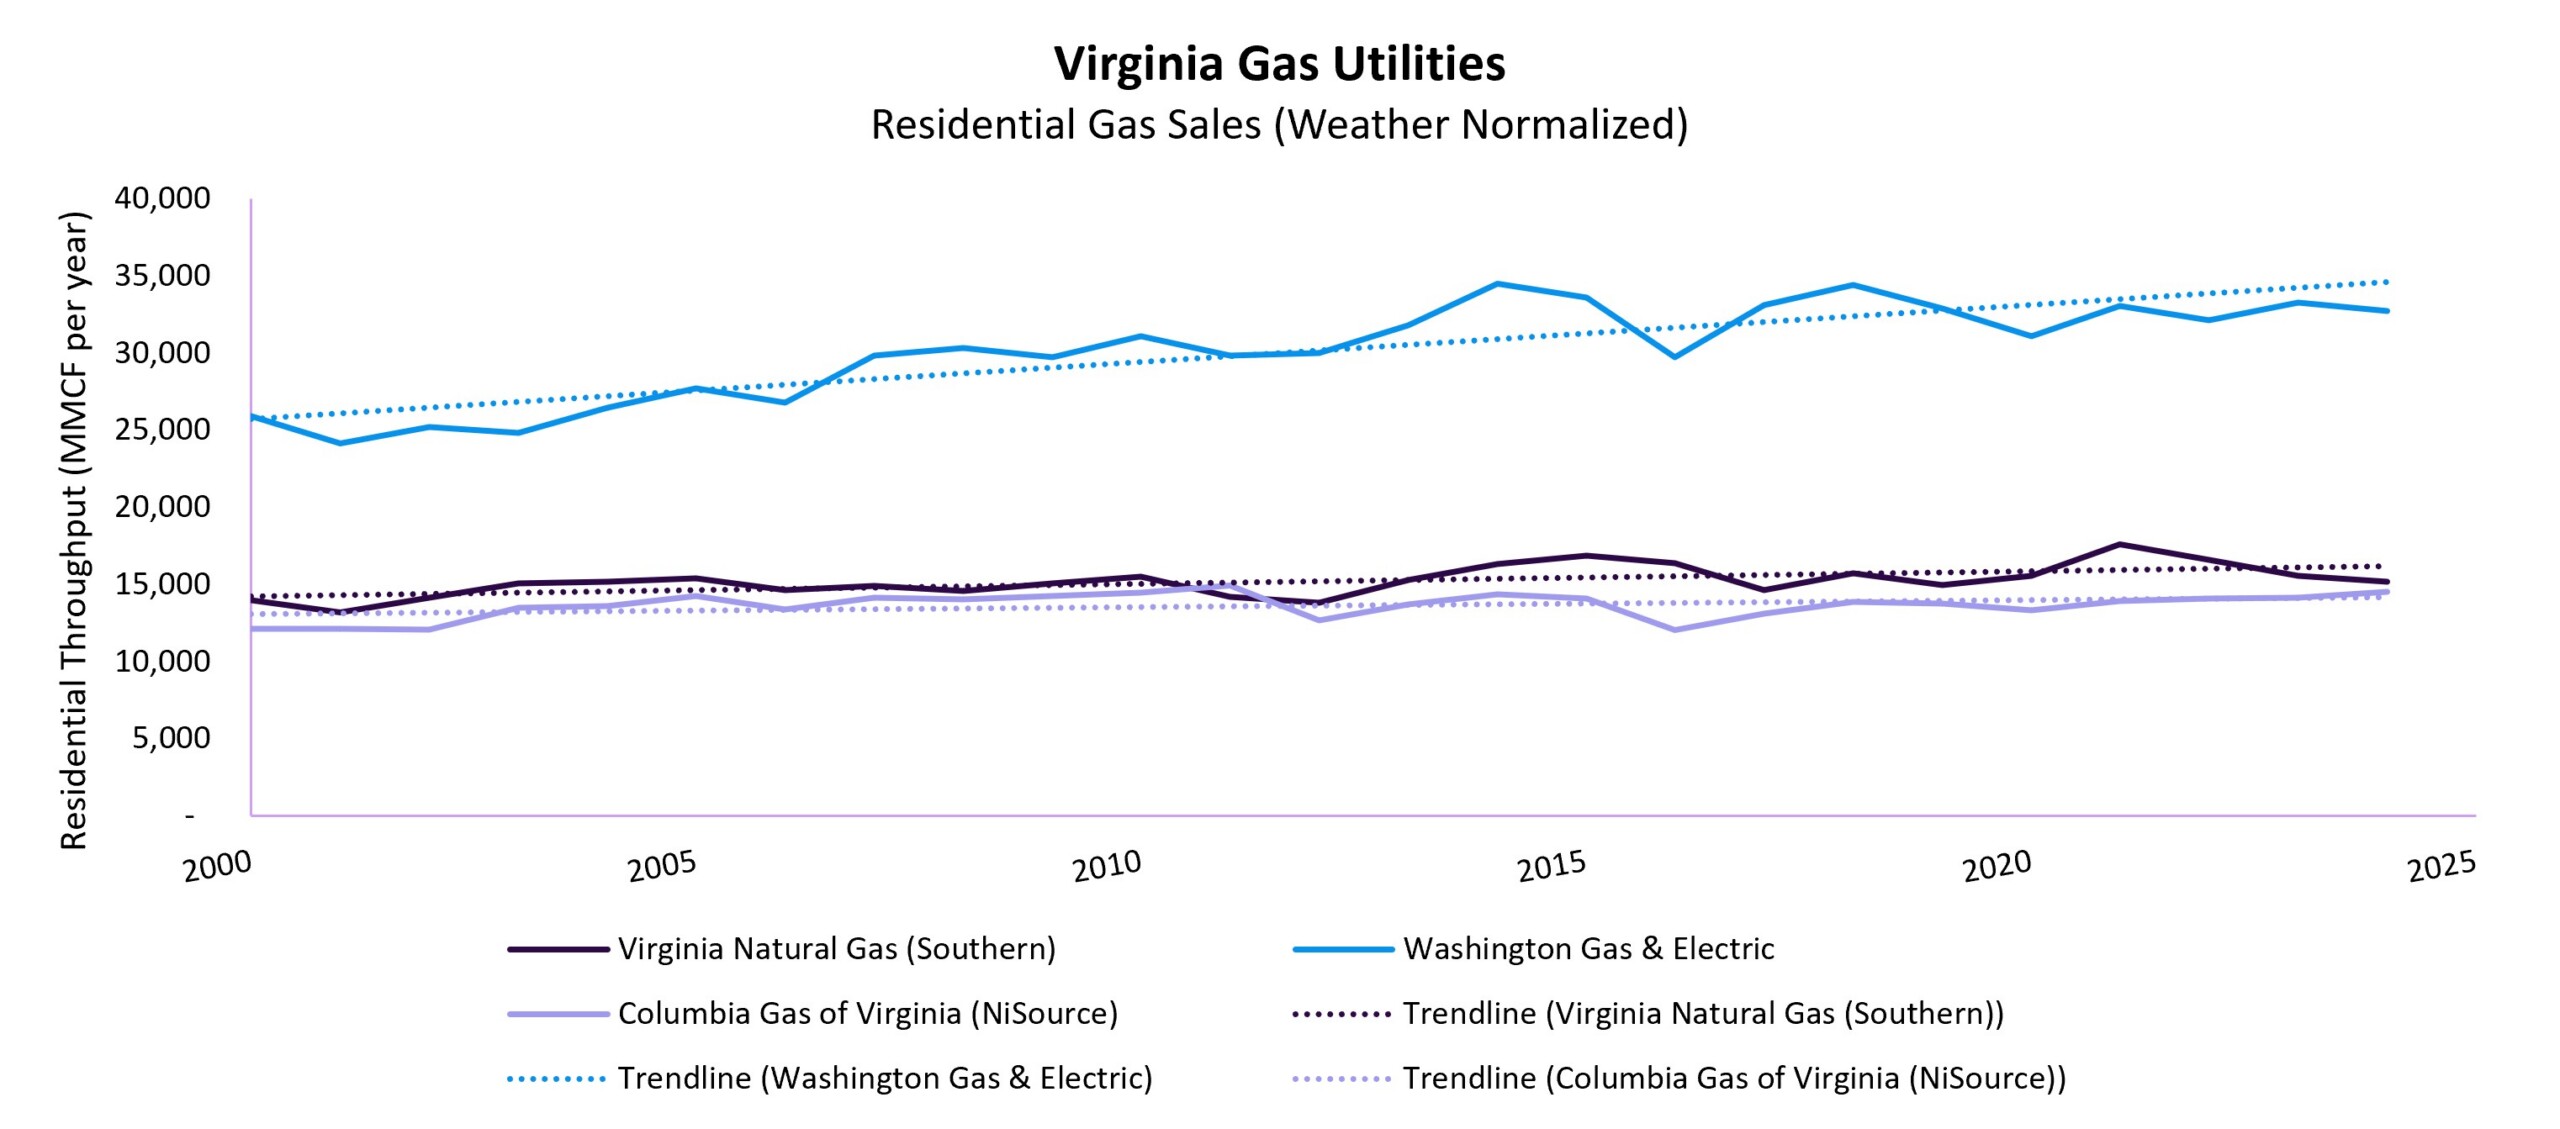
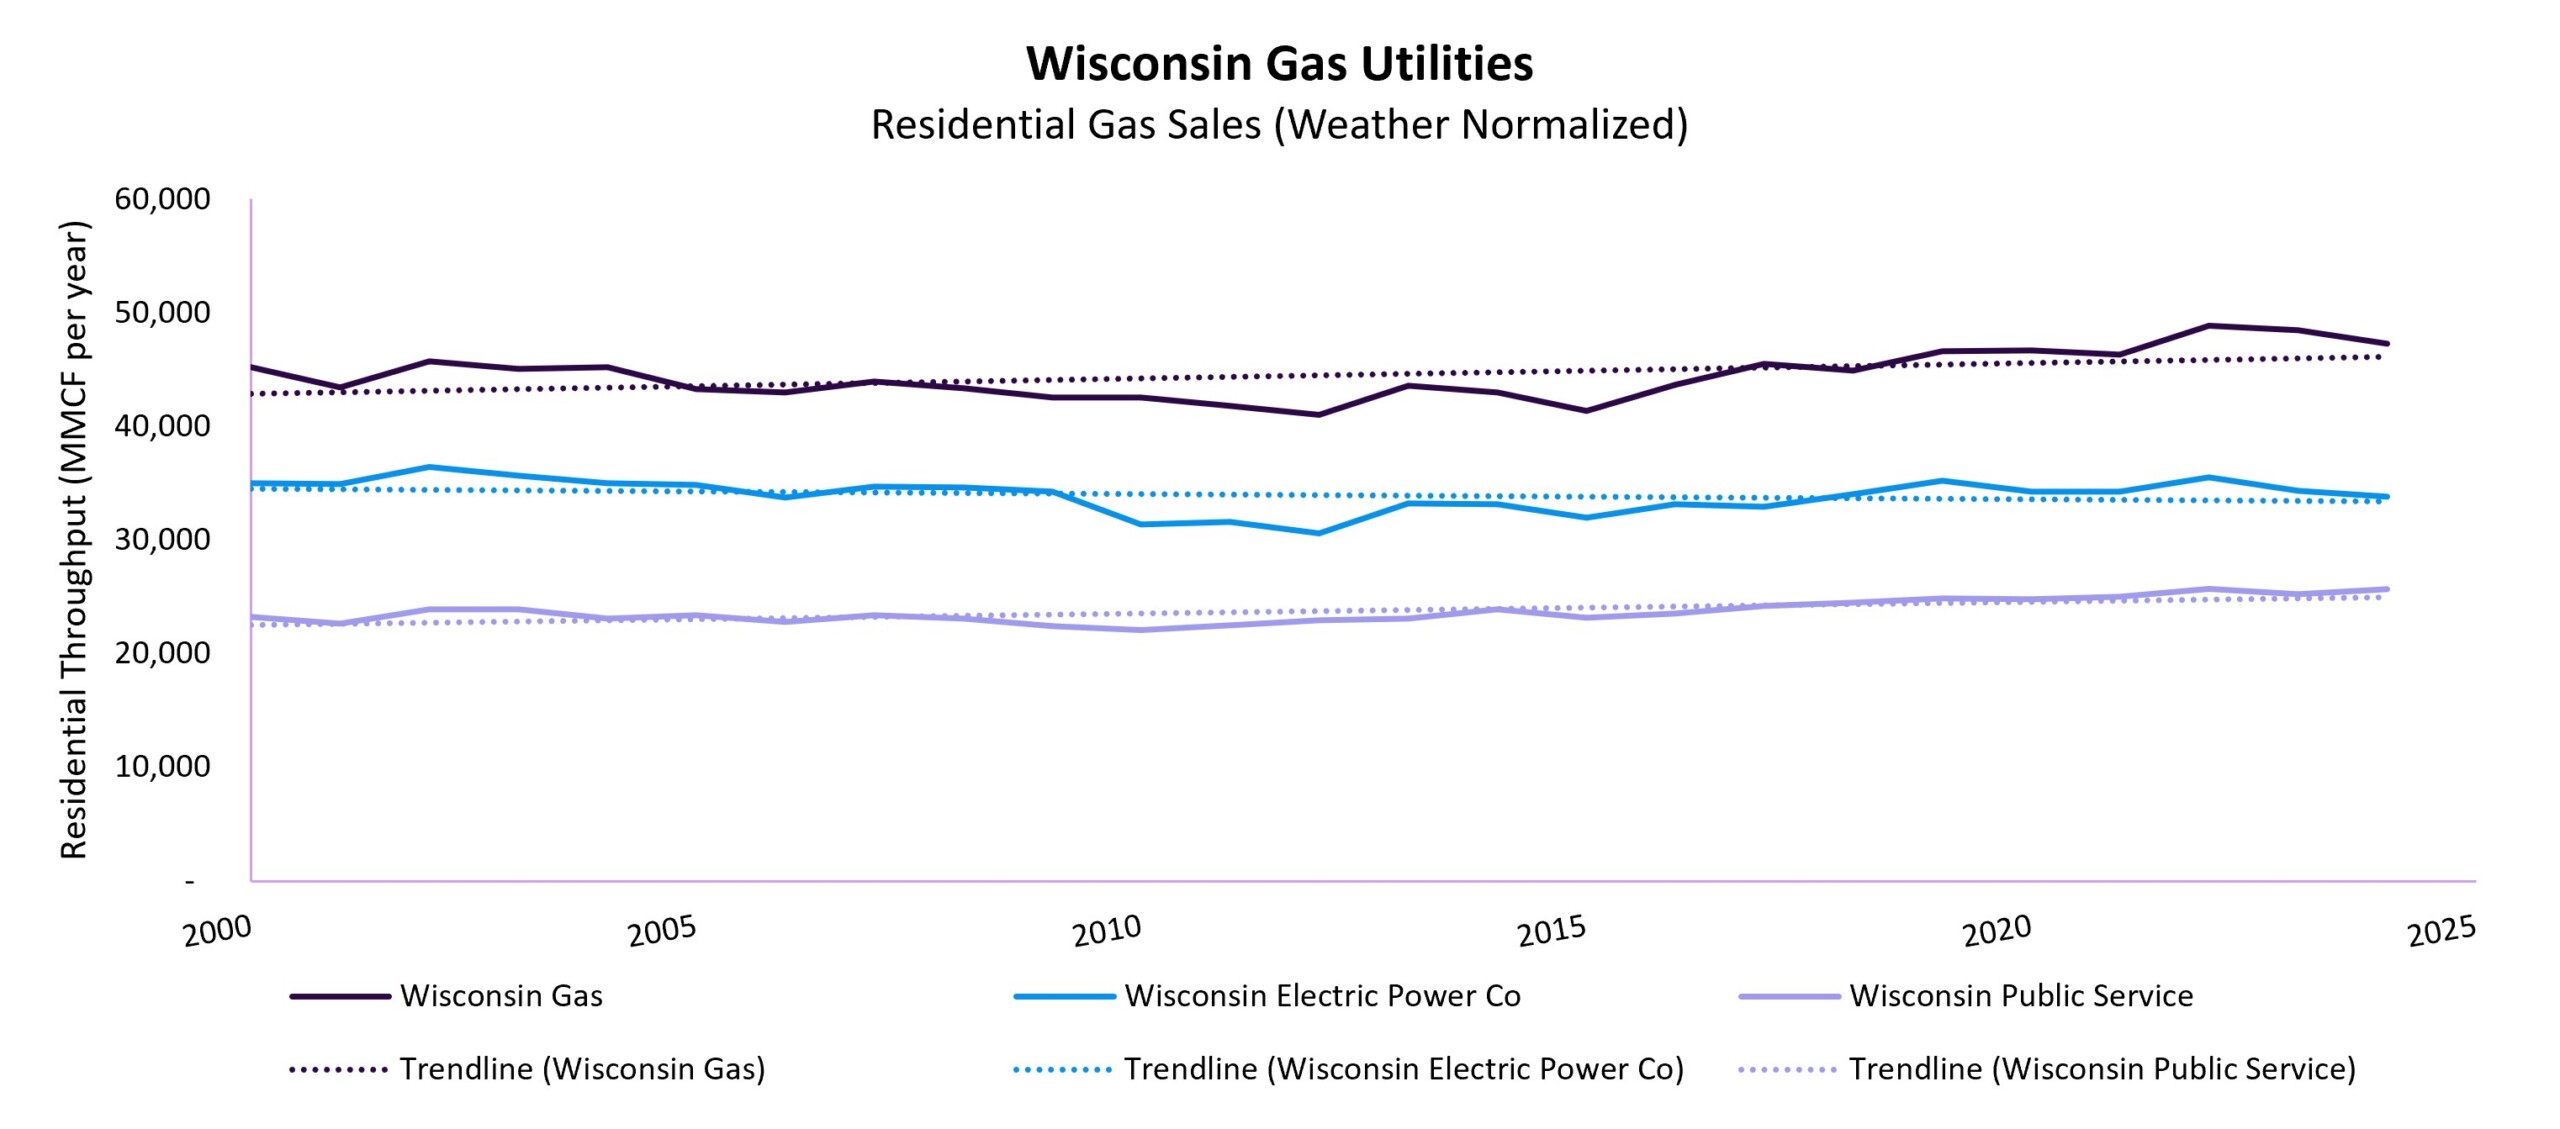
The total amount of gas sold to residential customers continues to increase in most states. Like the number of customers, this metric is influenced by population changes, changes to the housing stock, general appliance and building energy efficiency and weatherization advancements, customer behavior, and electrification. The utilities seeing slight downward trends include Pacific Gas & Electric and Southern California Gas, Xcel Colorado, Consumers Energy Michigan, and Illinois’s Ameren, Peoples, and Nicor. 2025 and 2026 data will be important to verify that this reduction in annual sales is an enduring trend versus a blip in the data.
This metric is an important one to watch over the next five to ten years. If residential sales fall as gas system spending continues to accelerate, rates will rise accordingly, making electrification more economical for homeowners for whom electrification was previously “out of the money” and placing additional burdens on those customers with little ability to control their own appliances, like renters.
Number of Commercial Customers
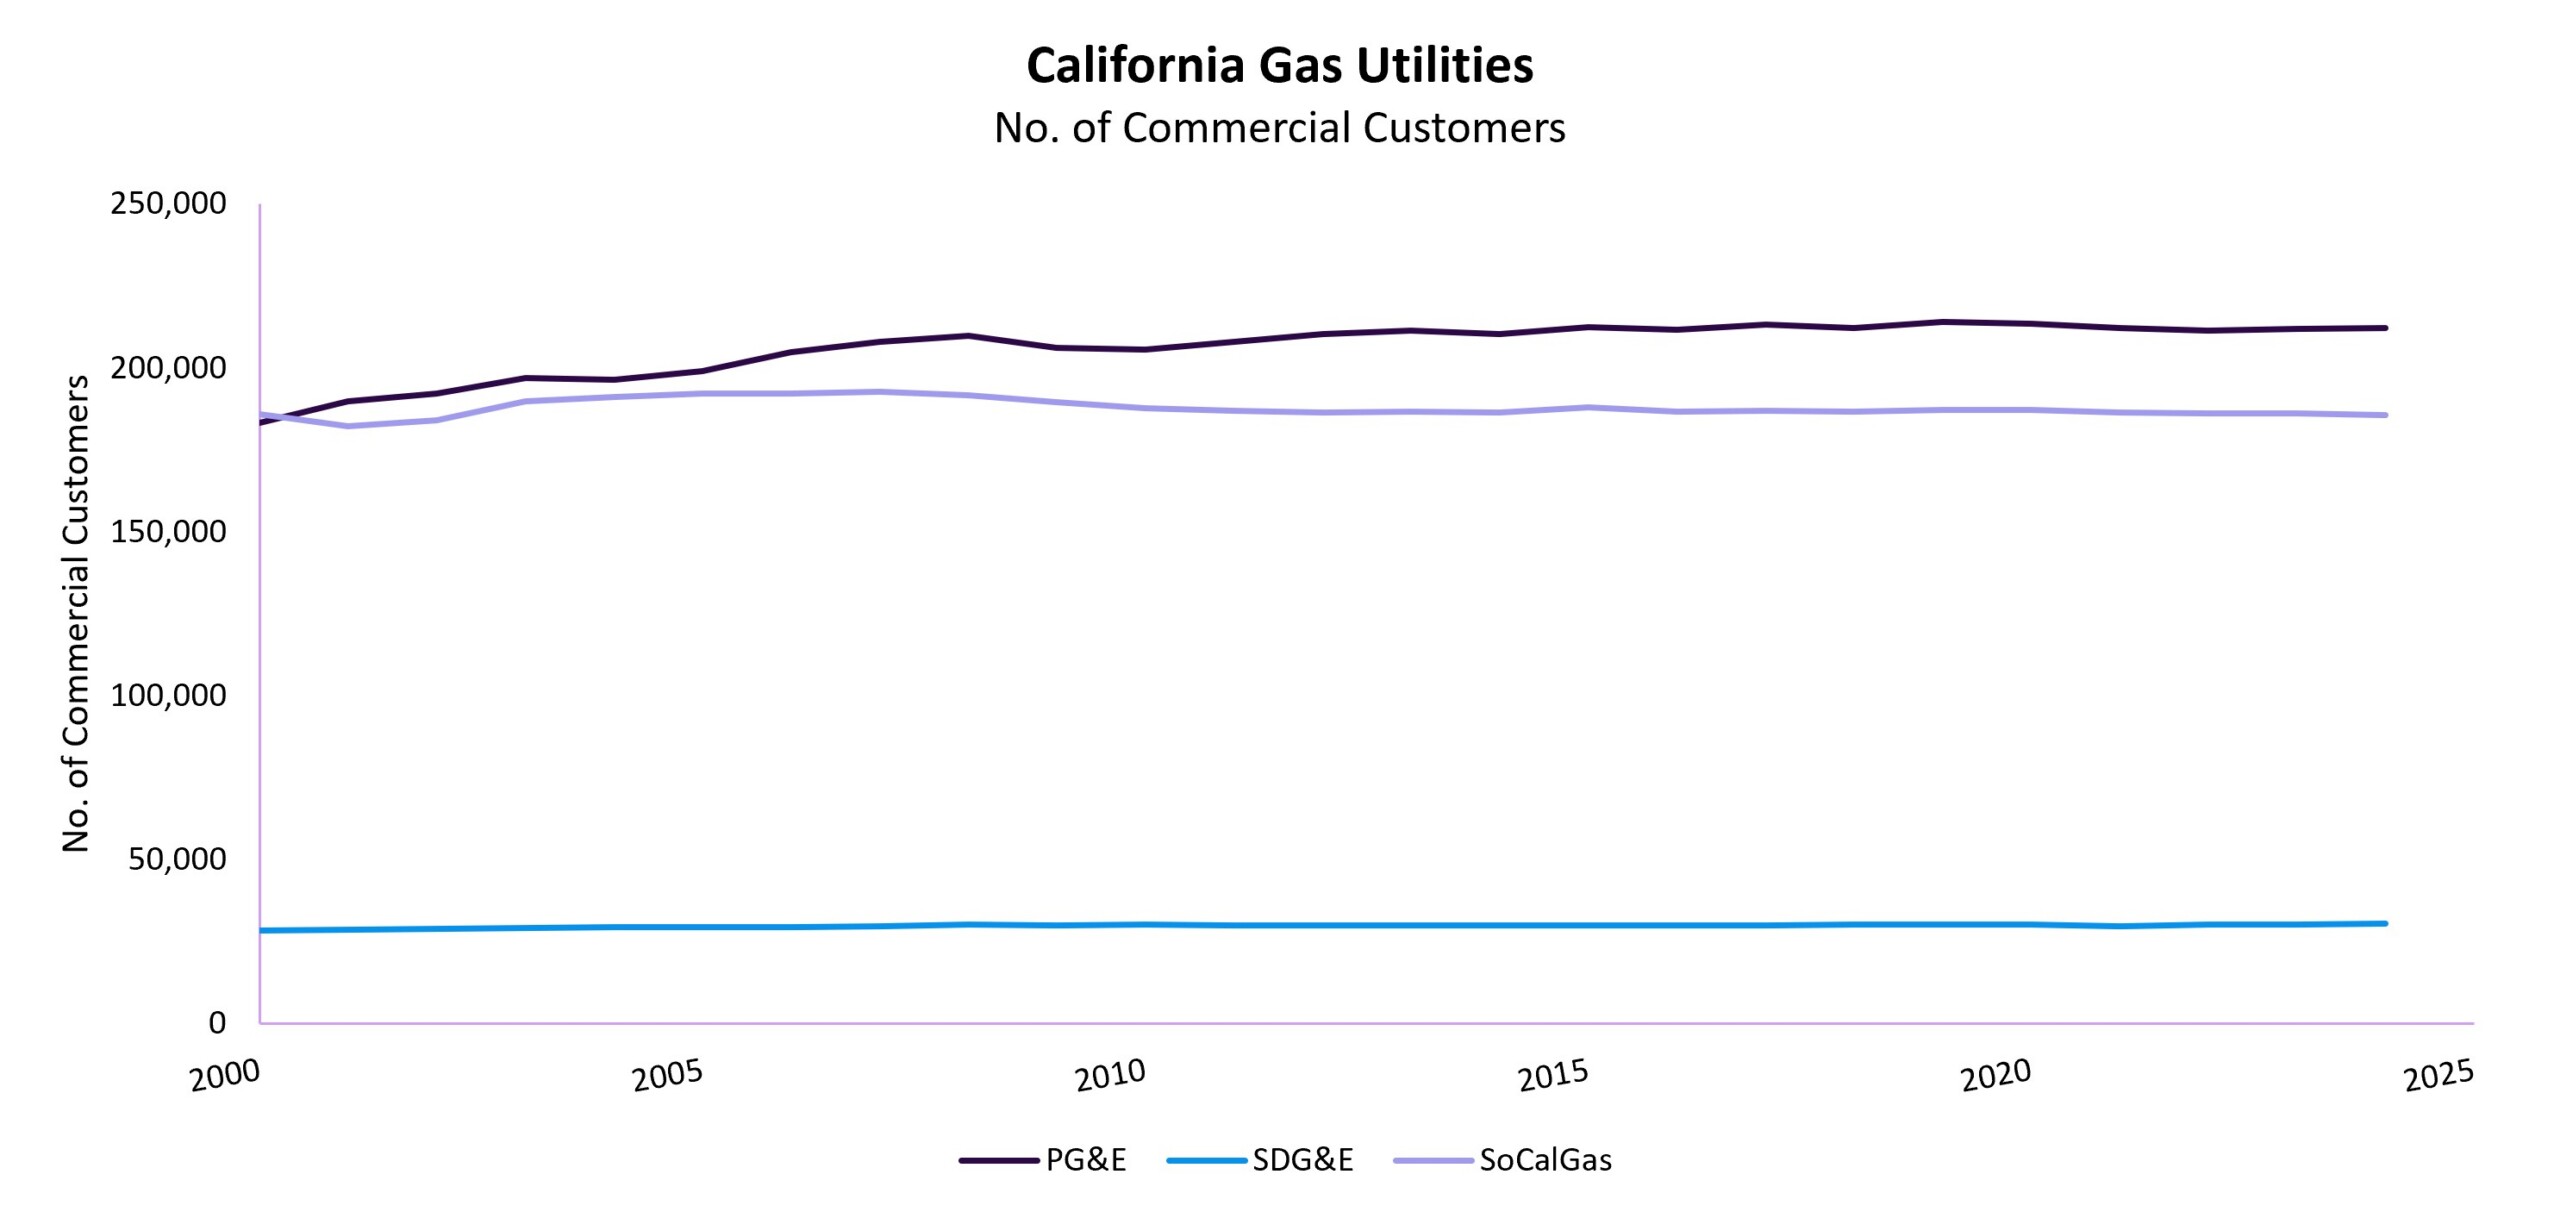
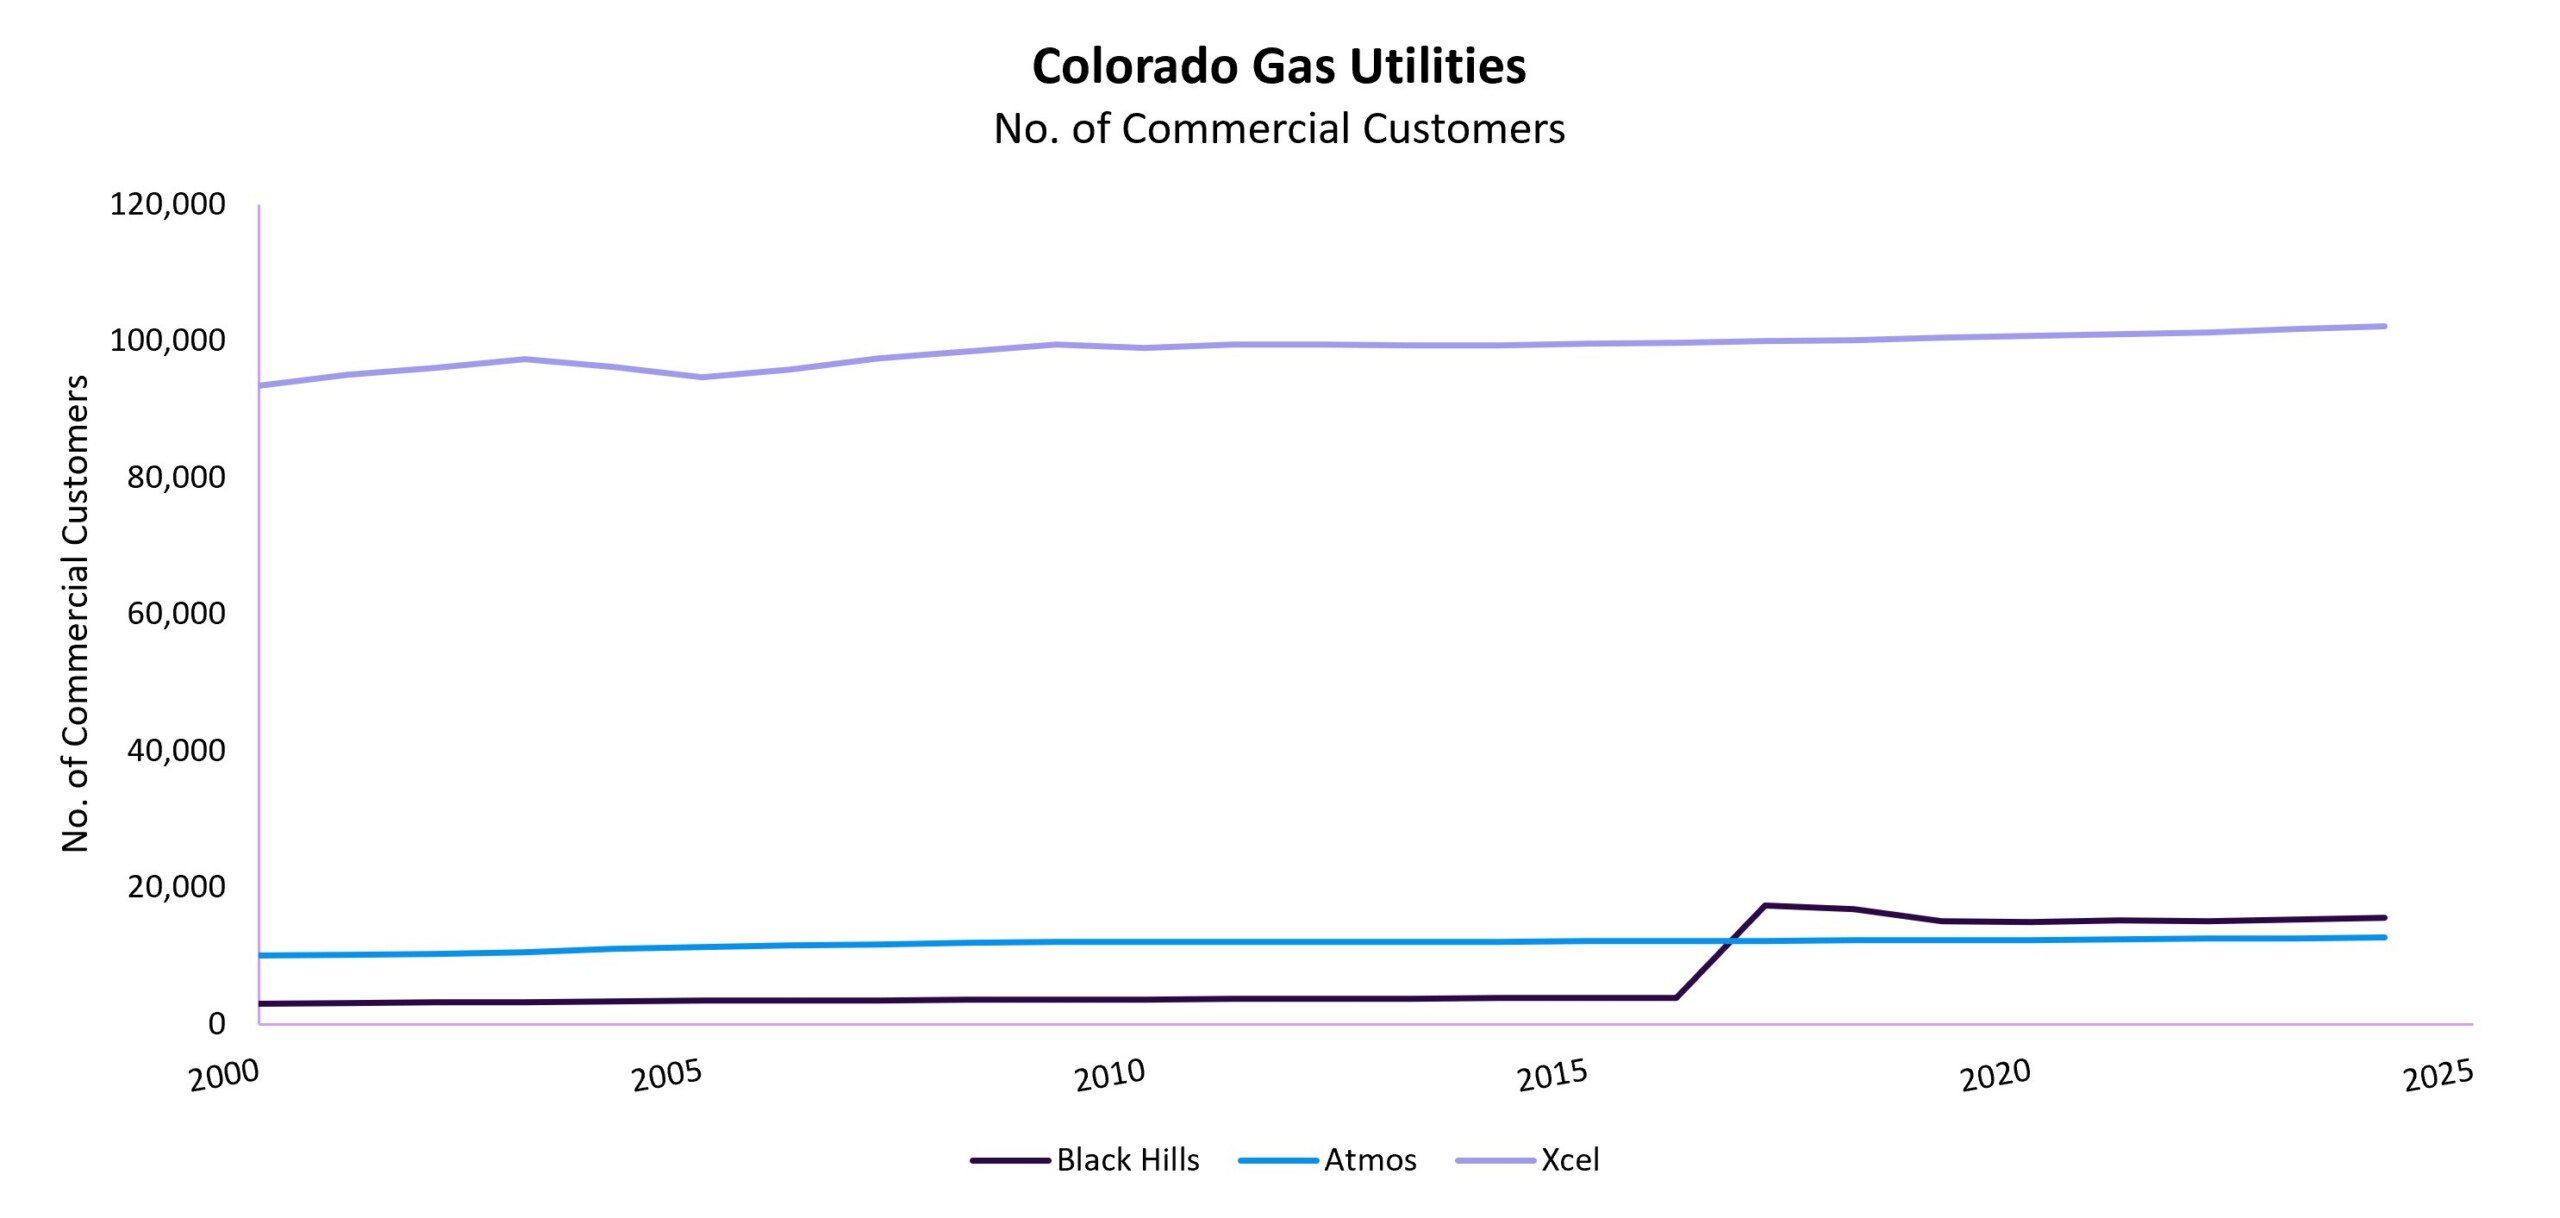
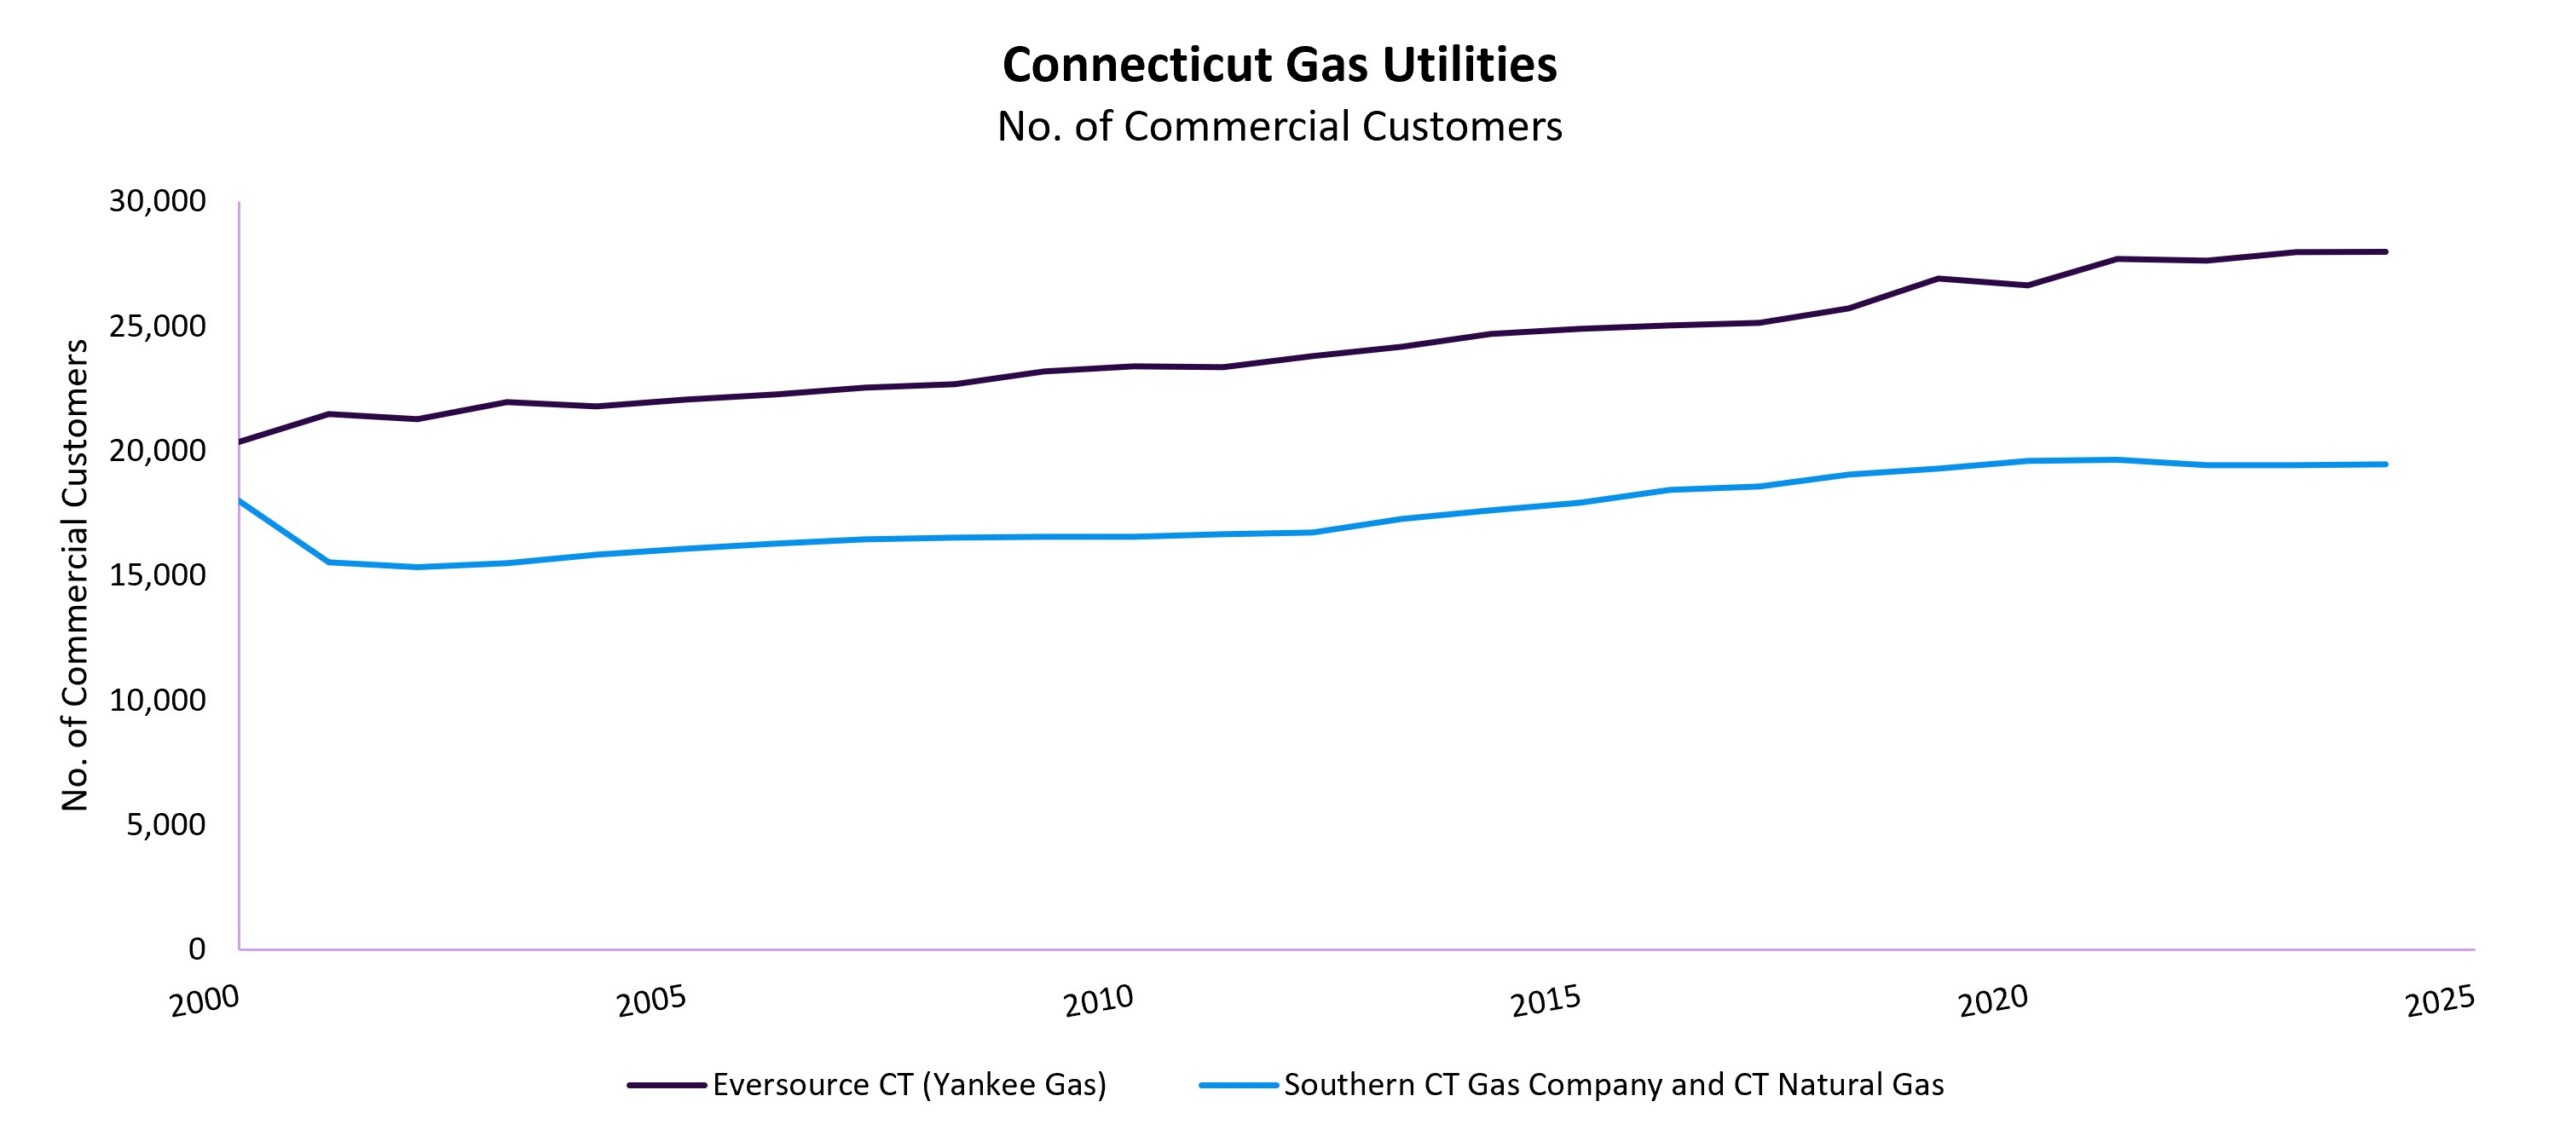
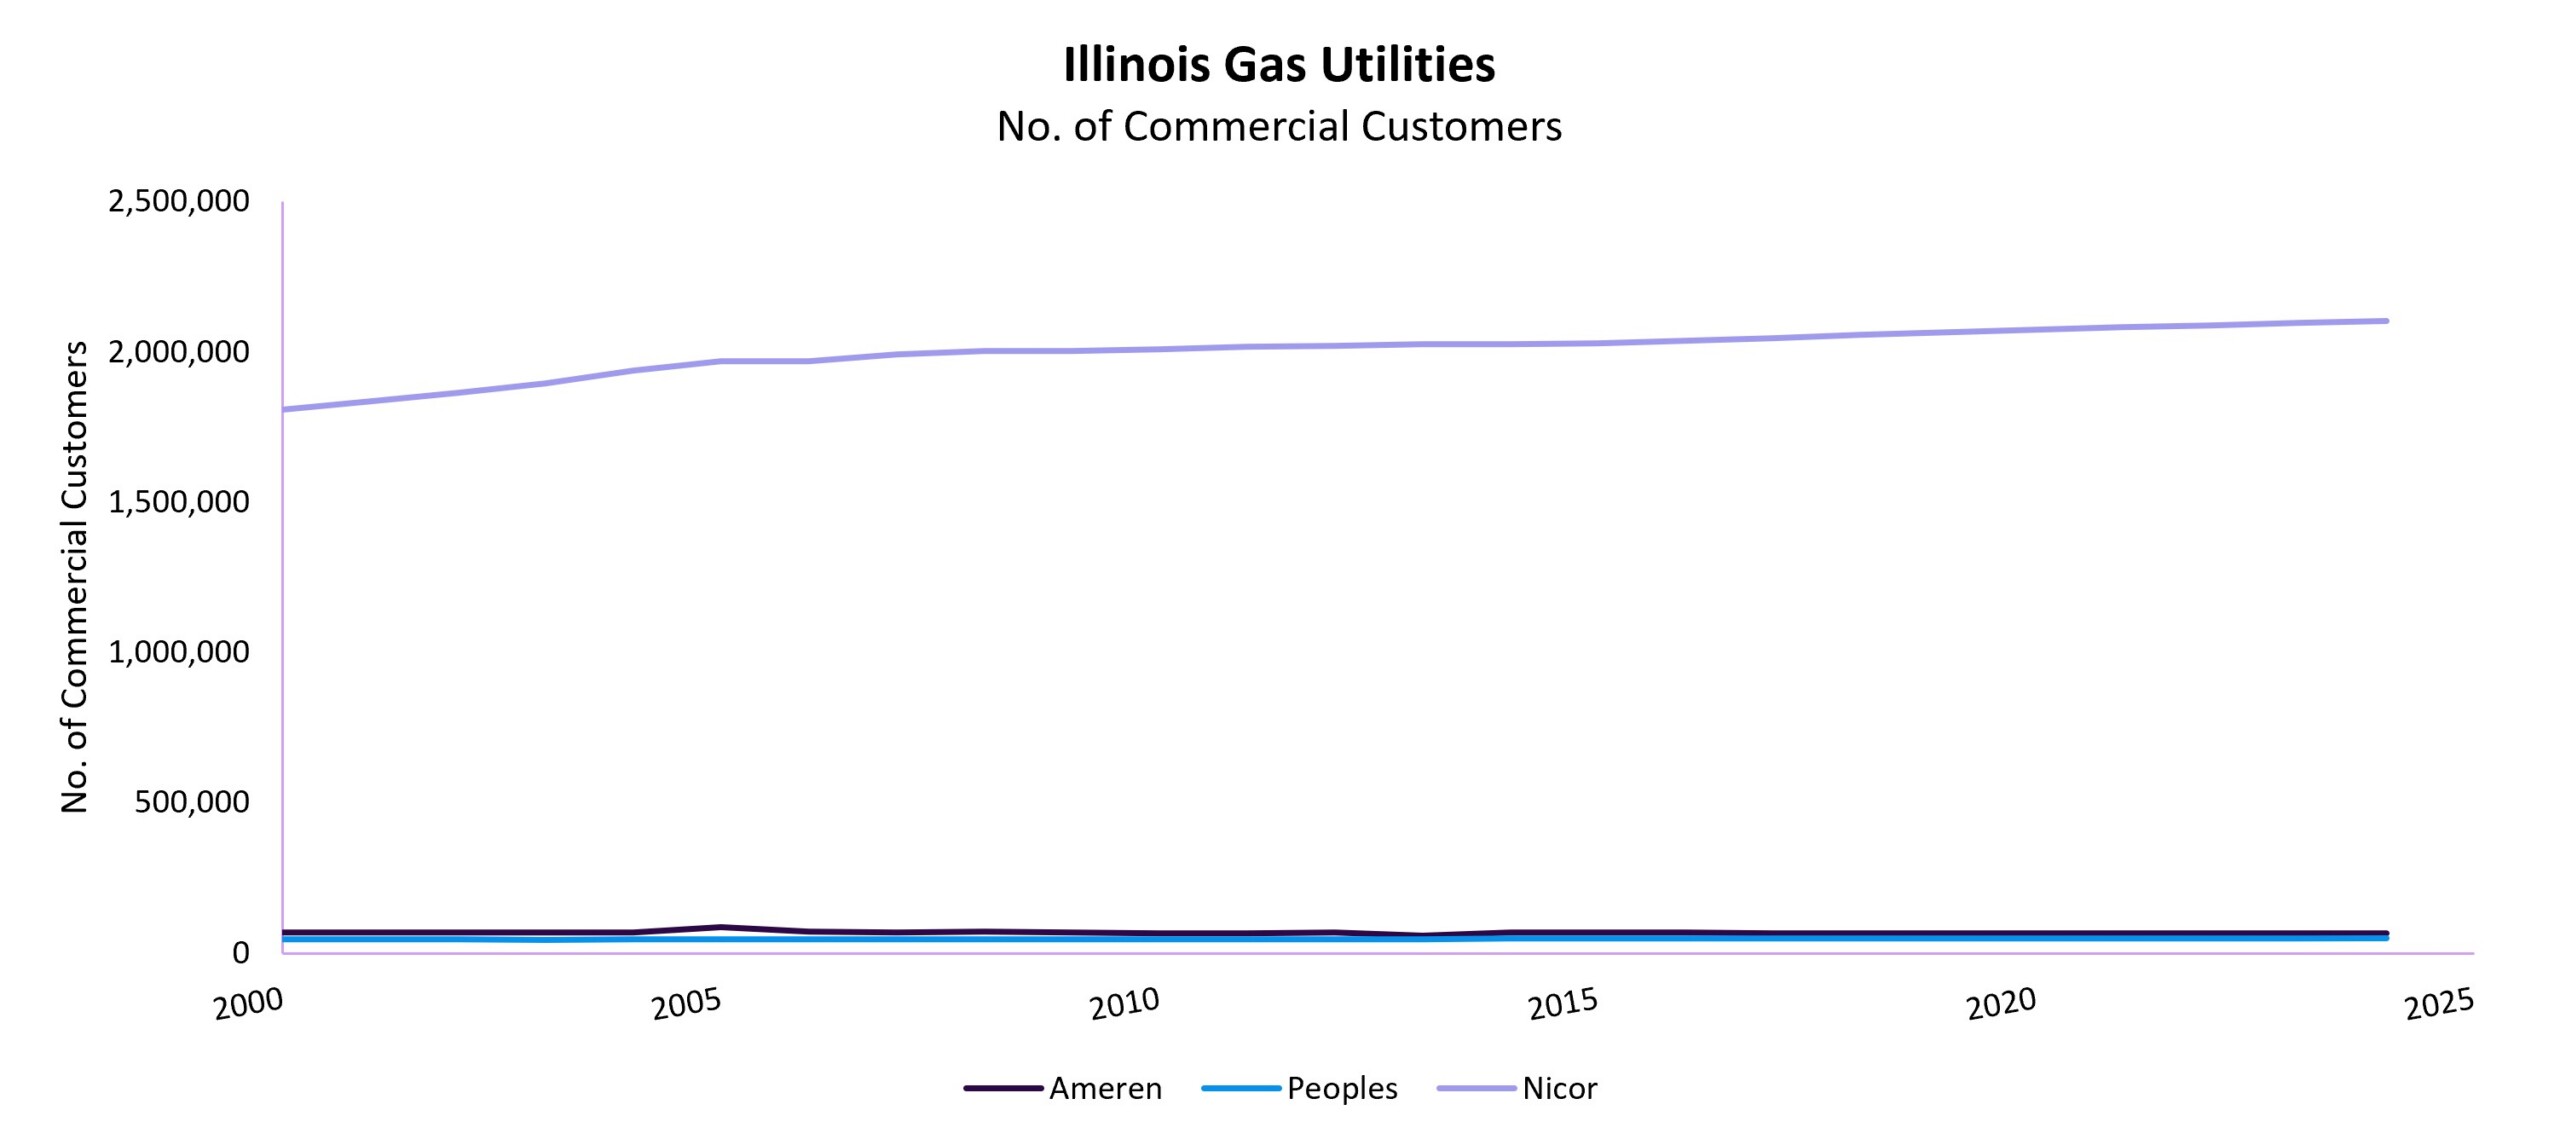
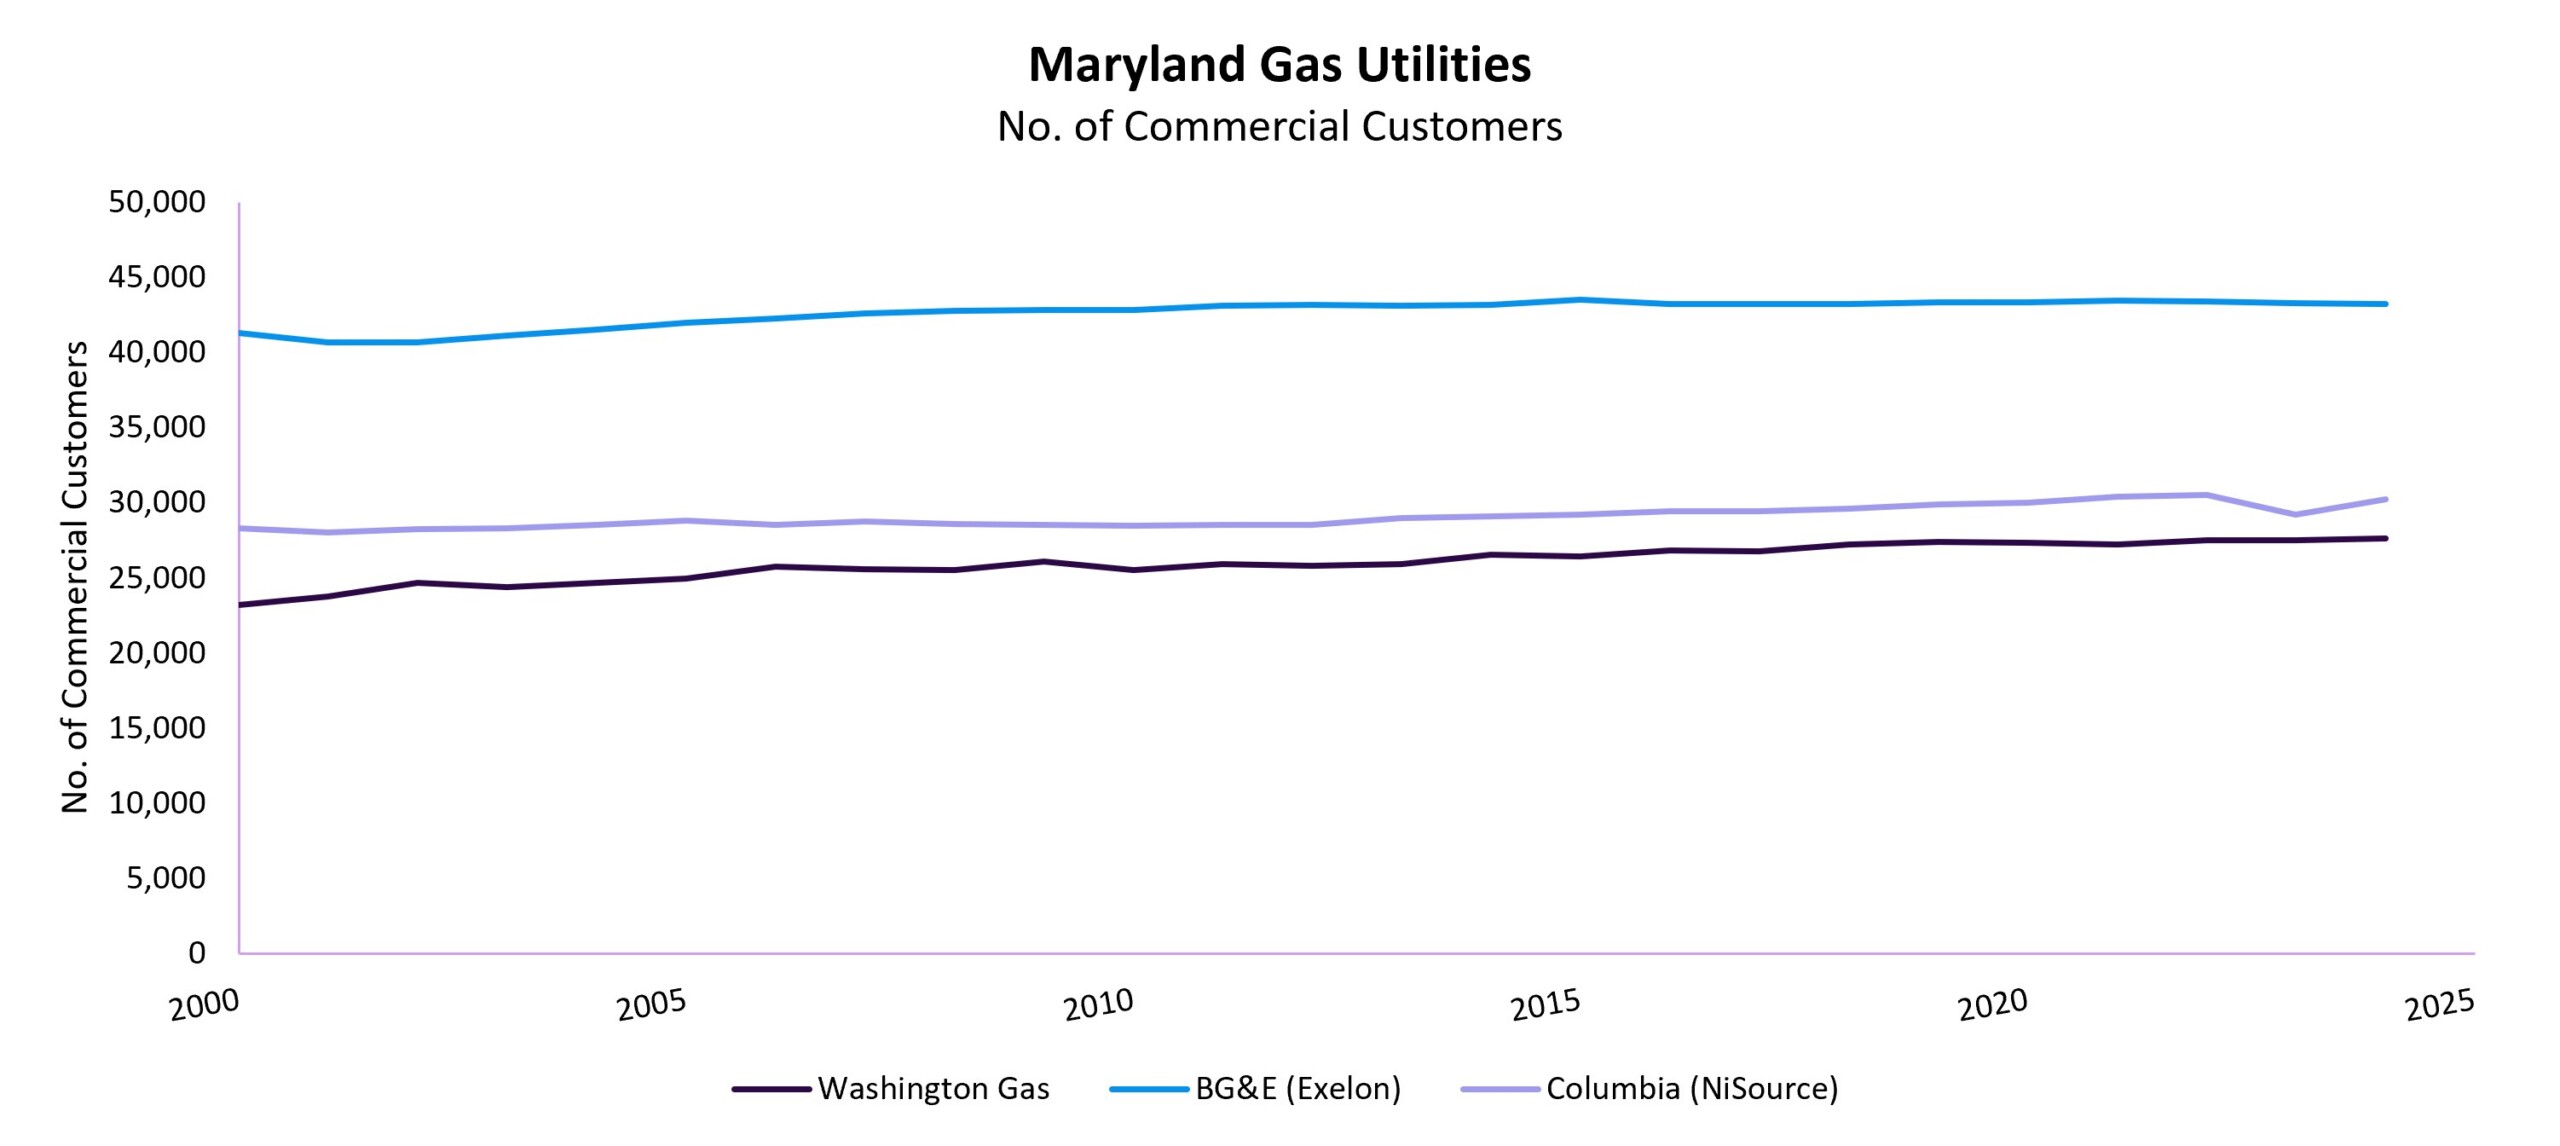
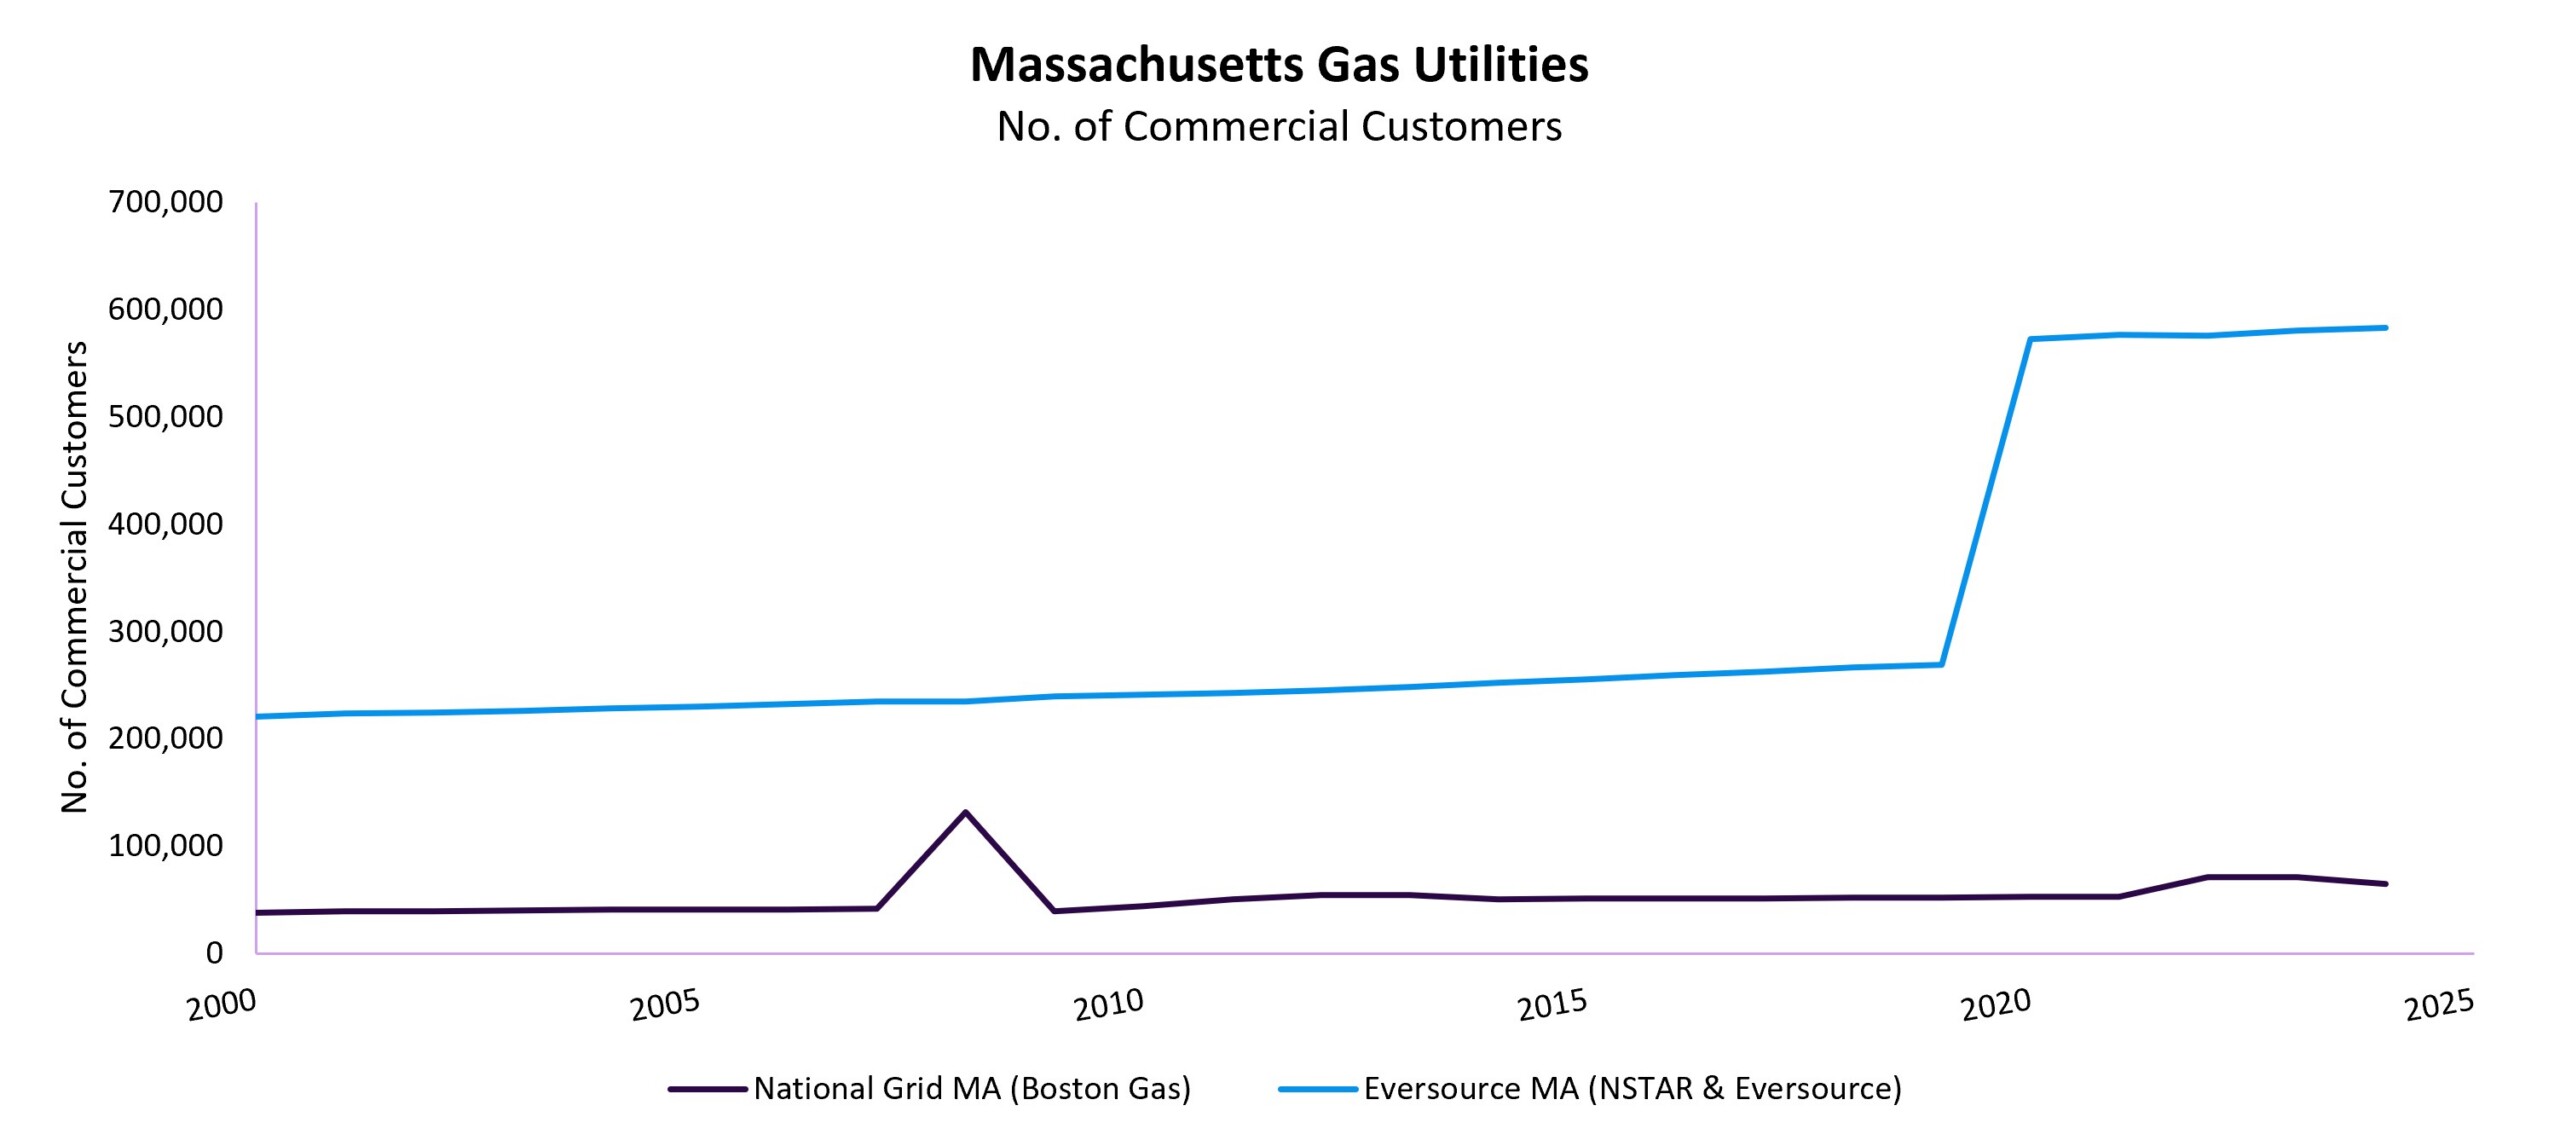
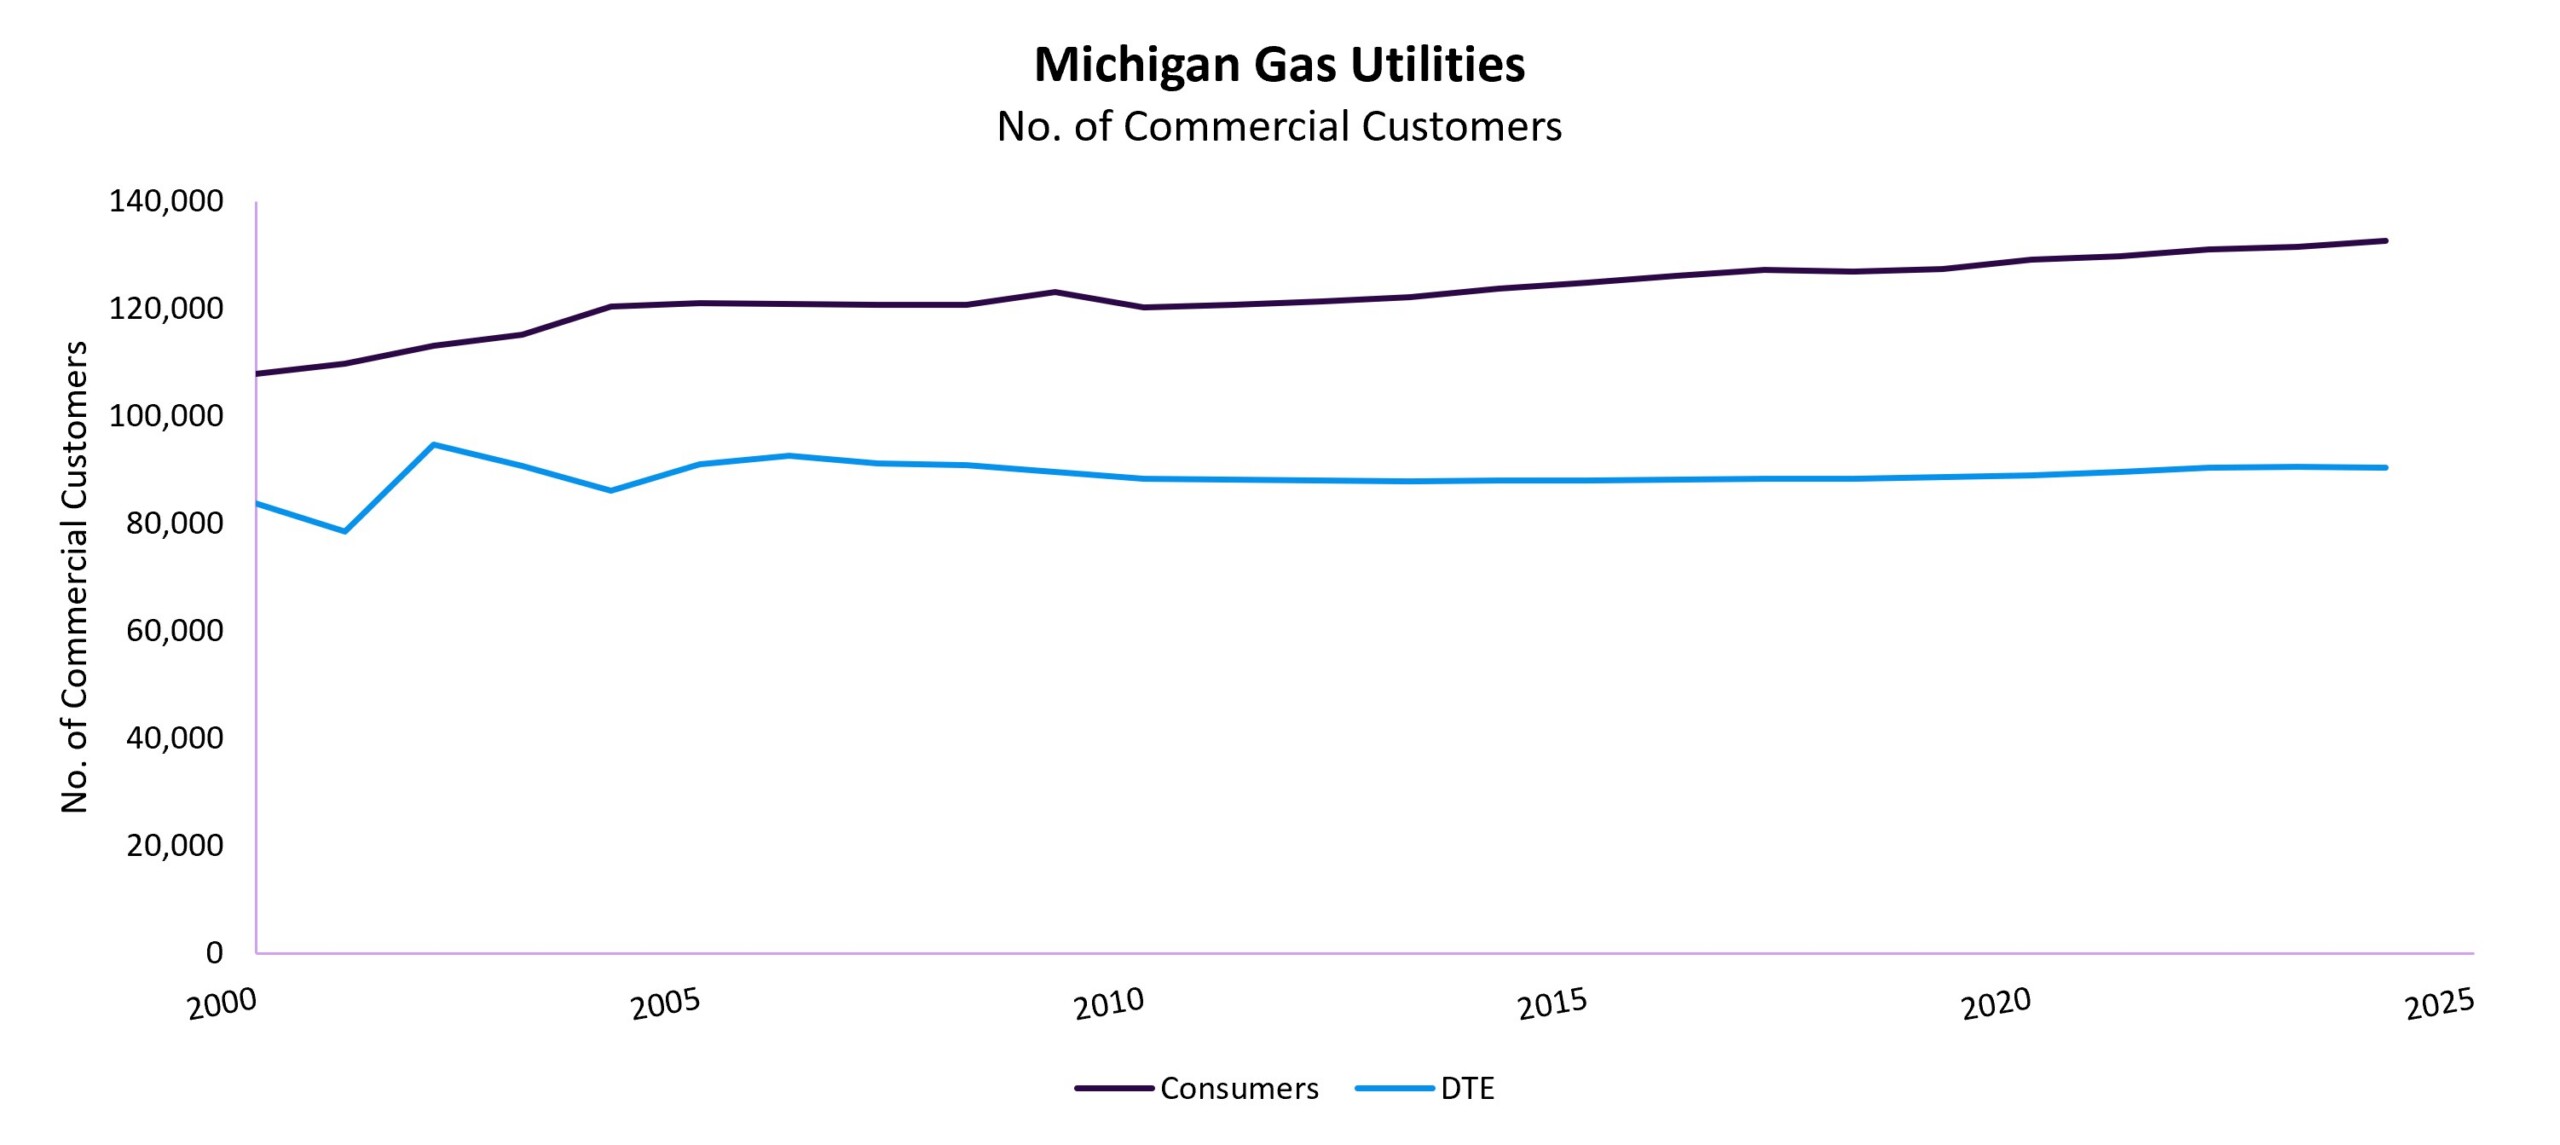
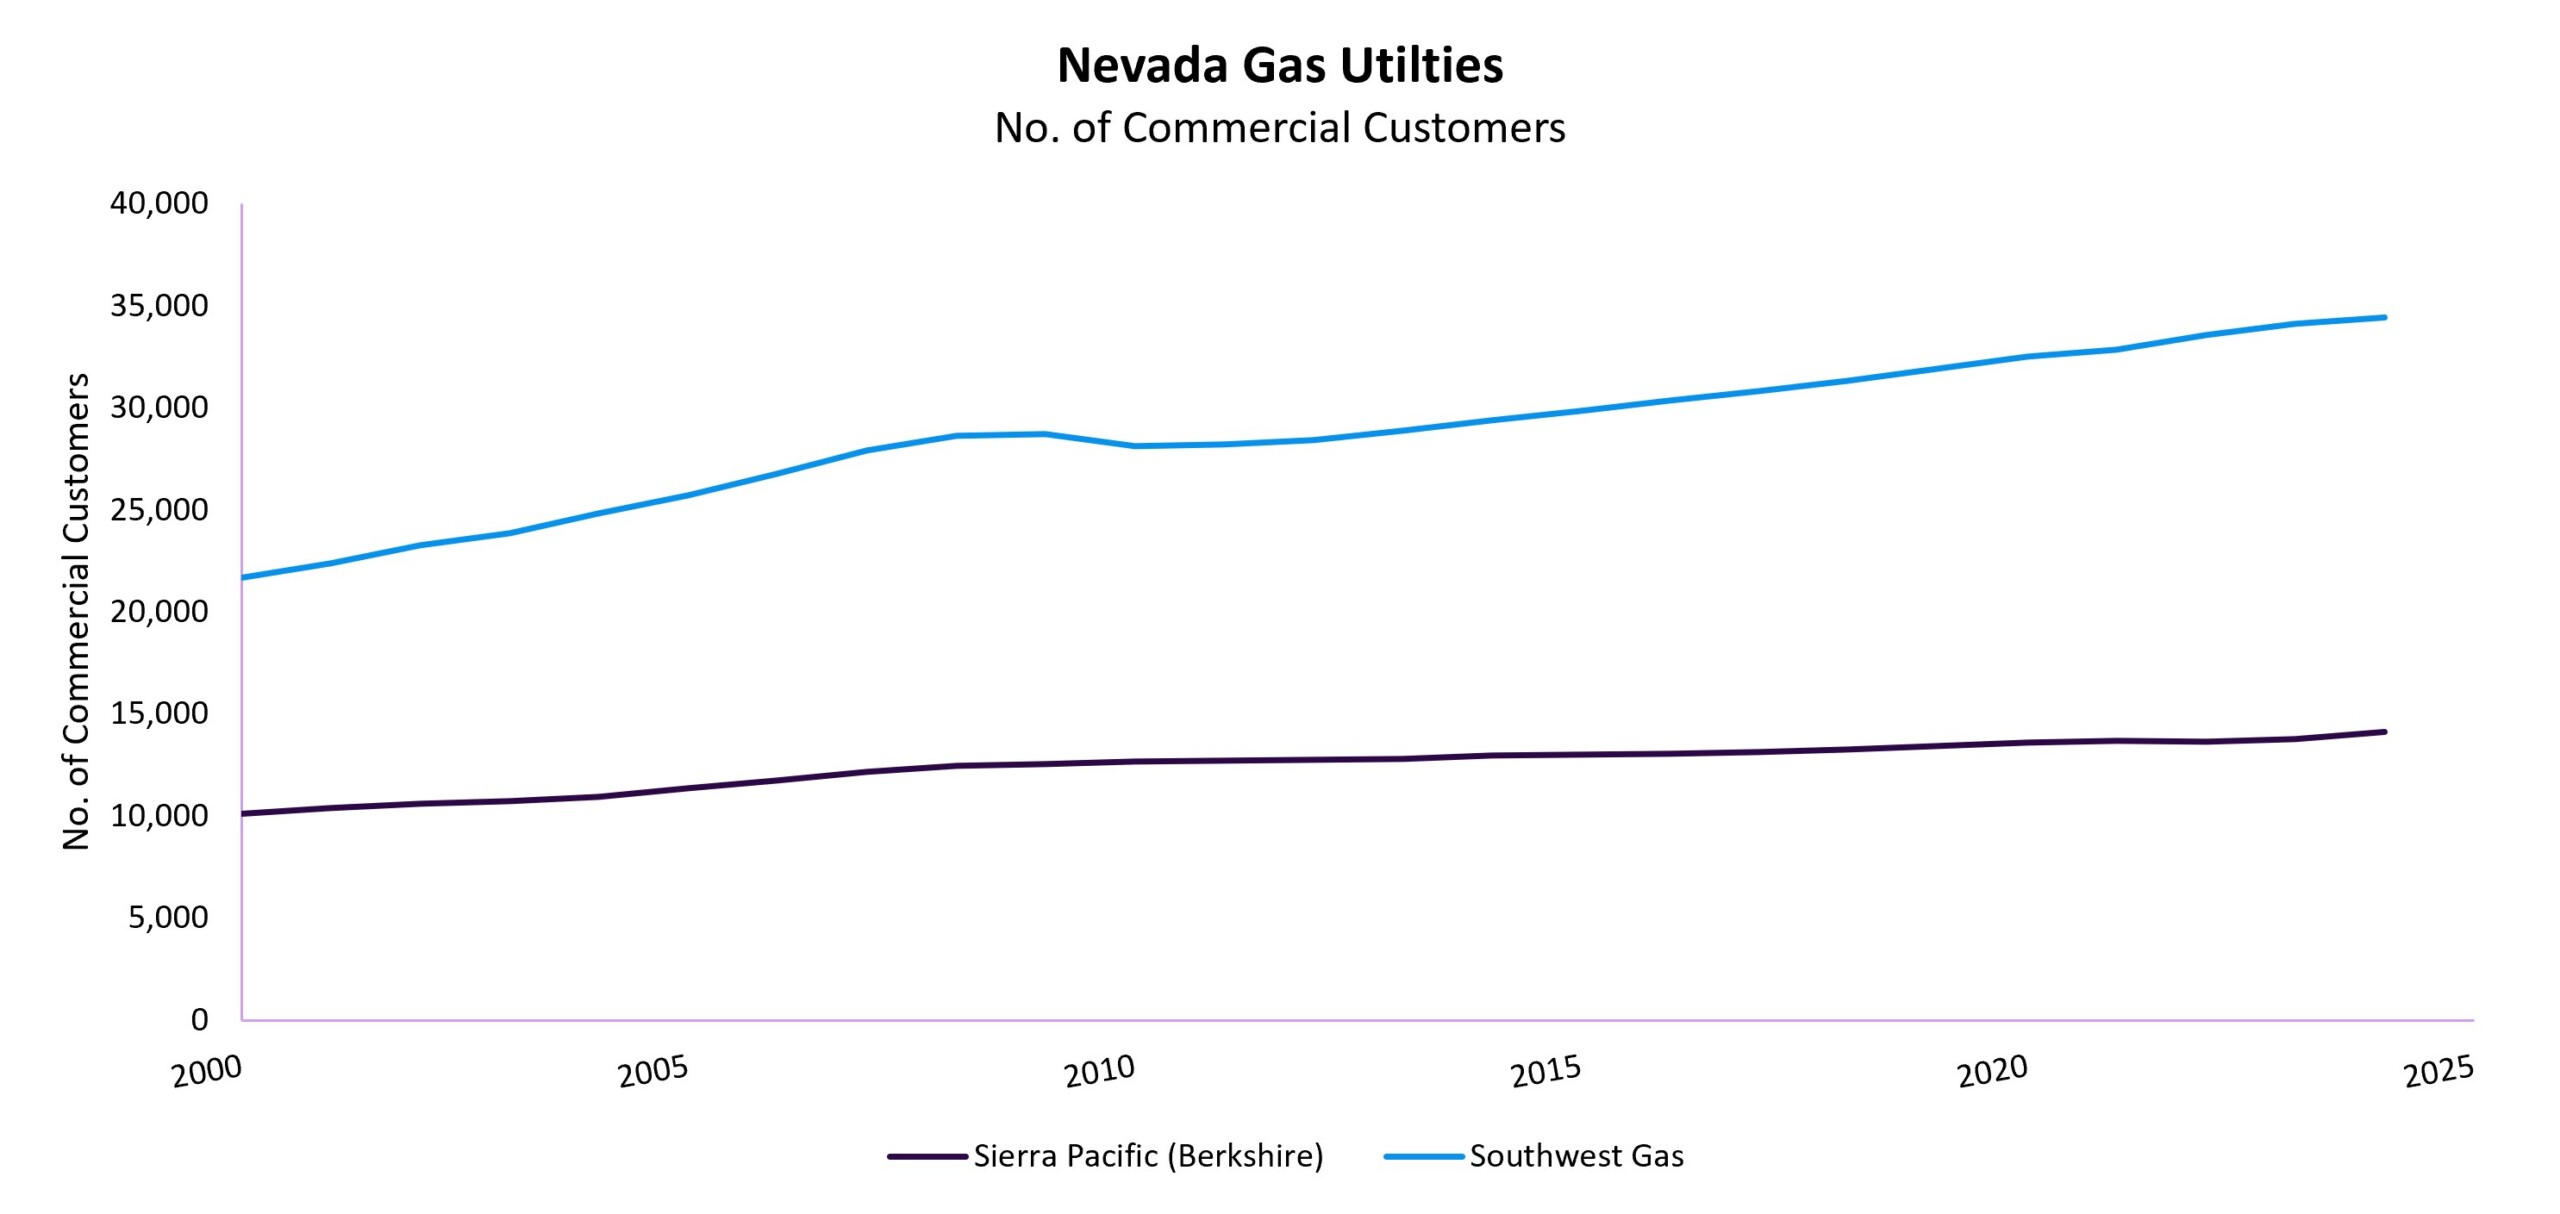
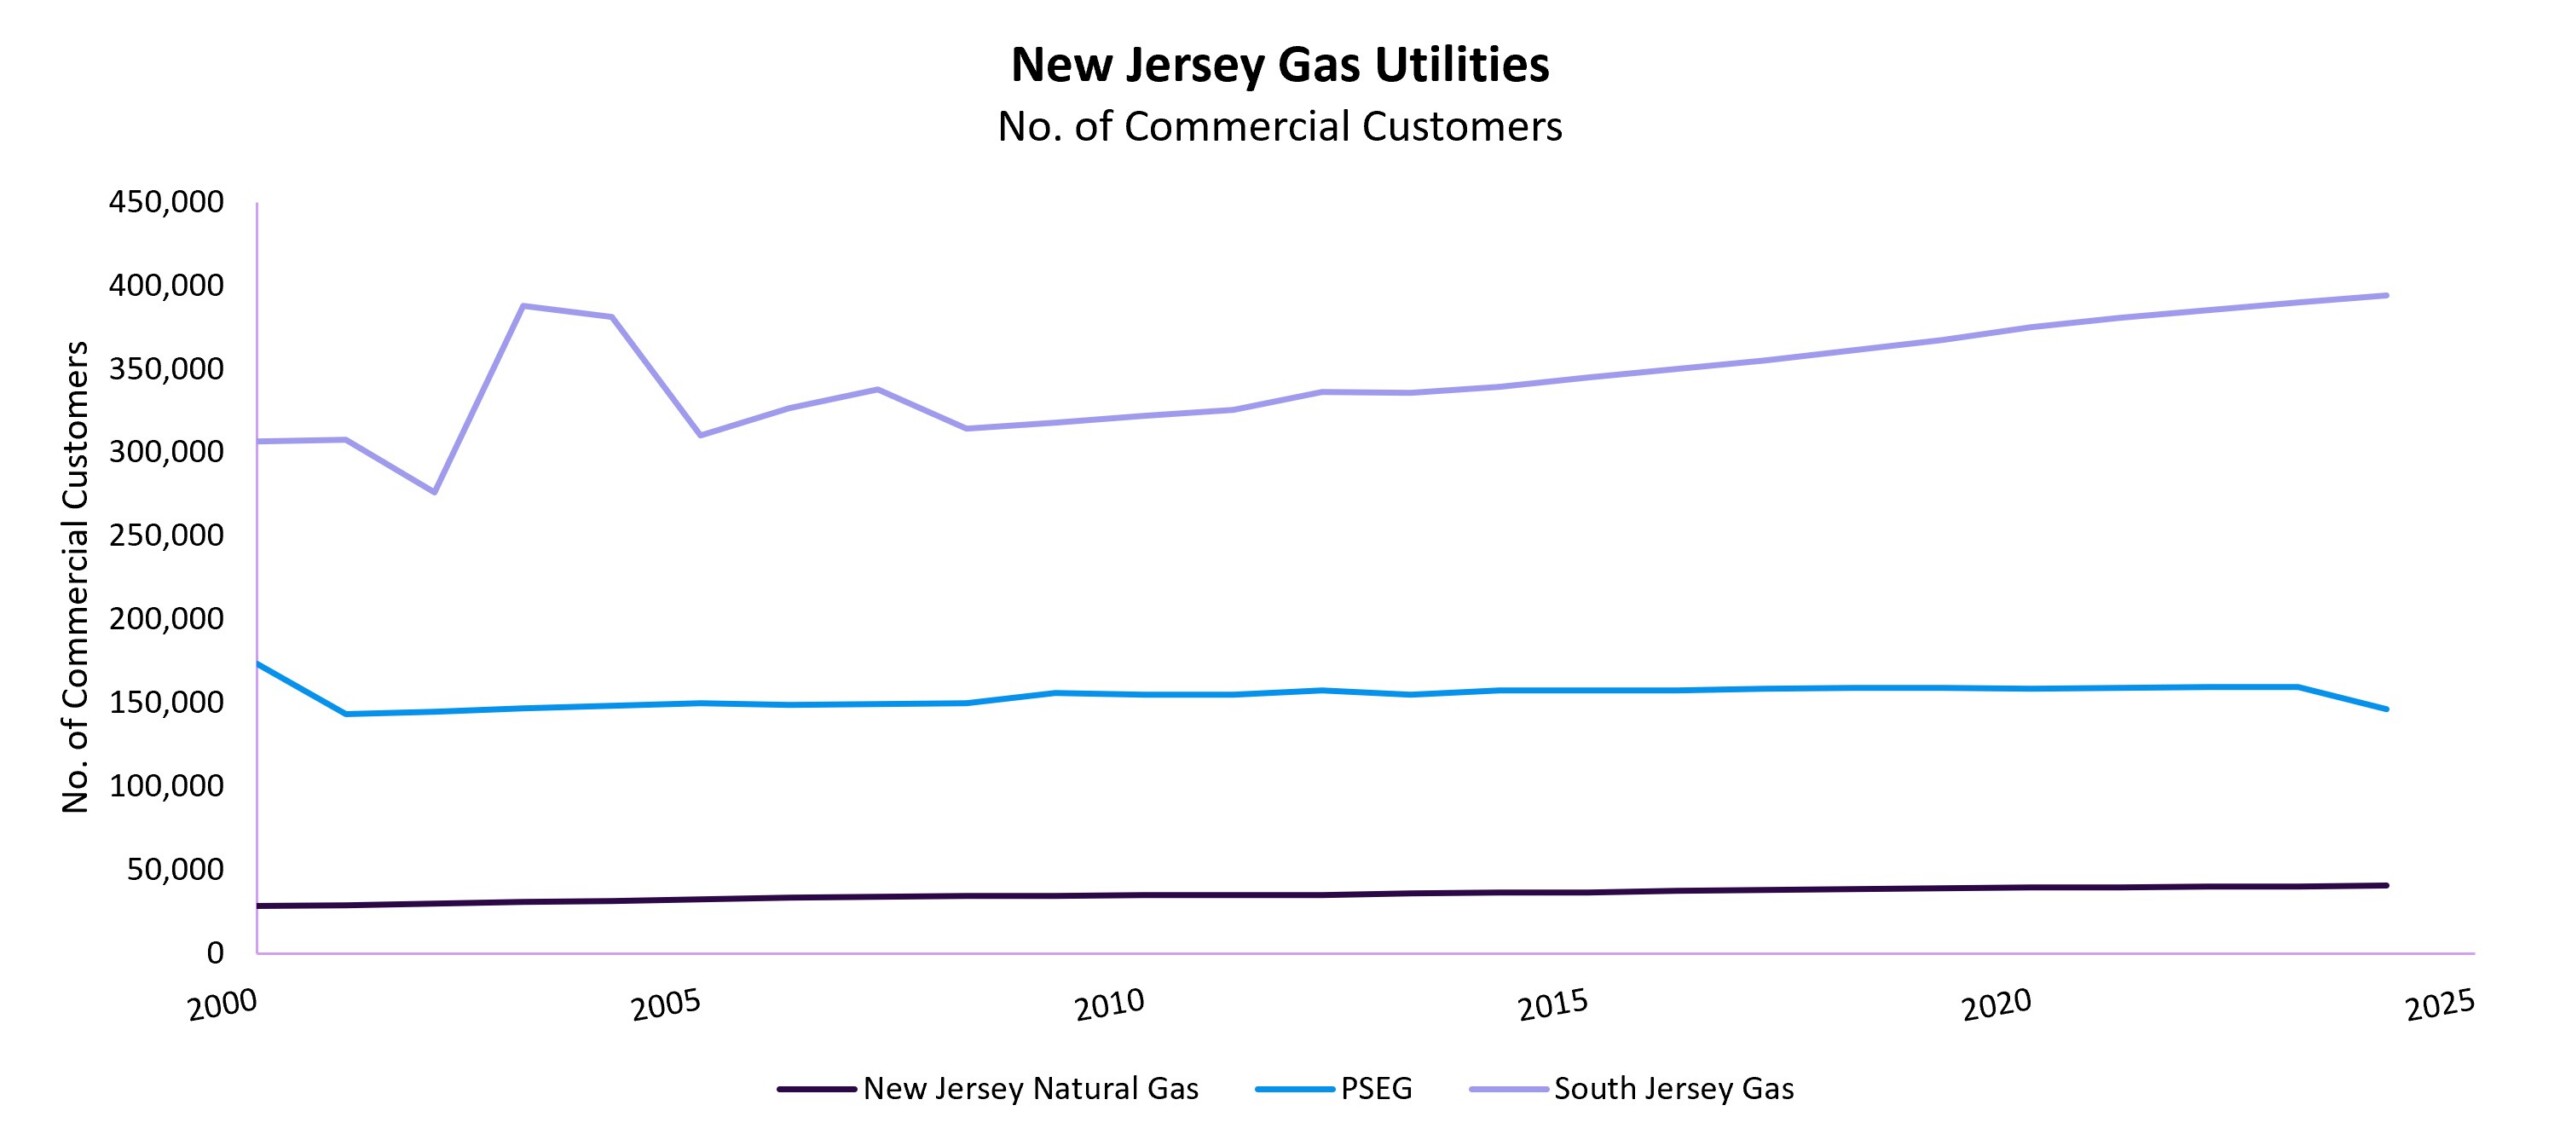
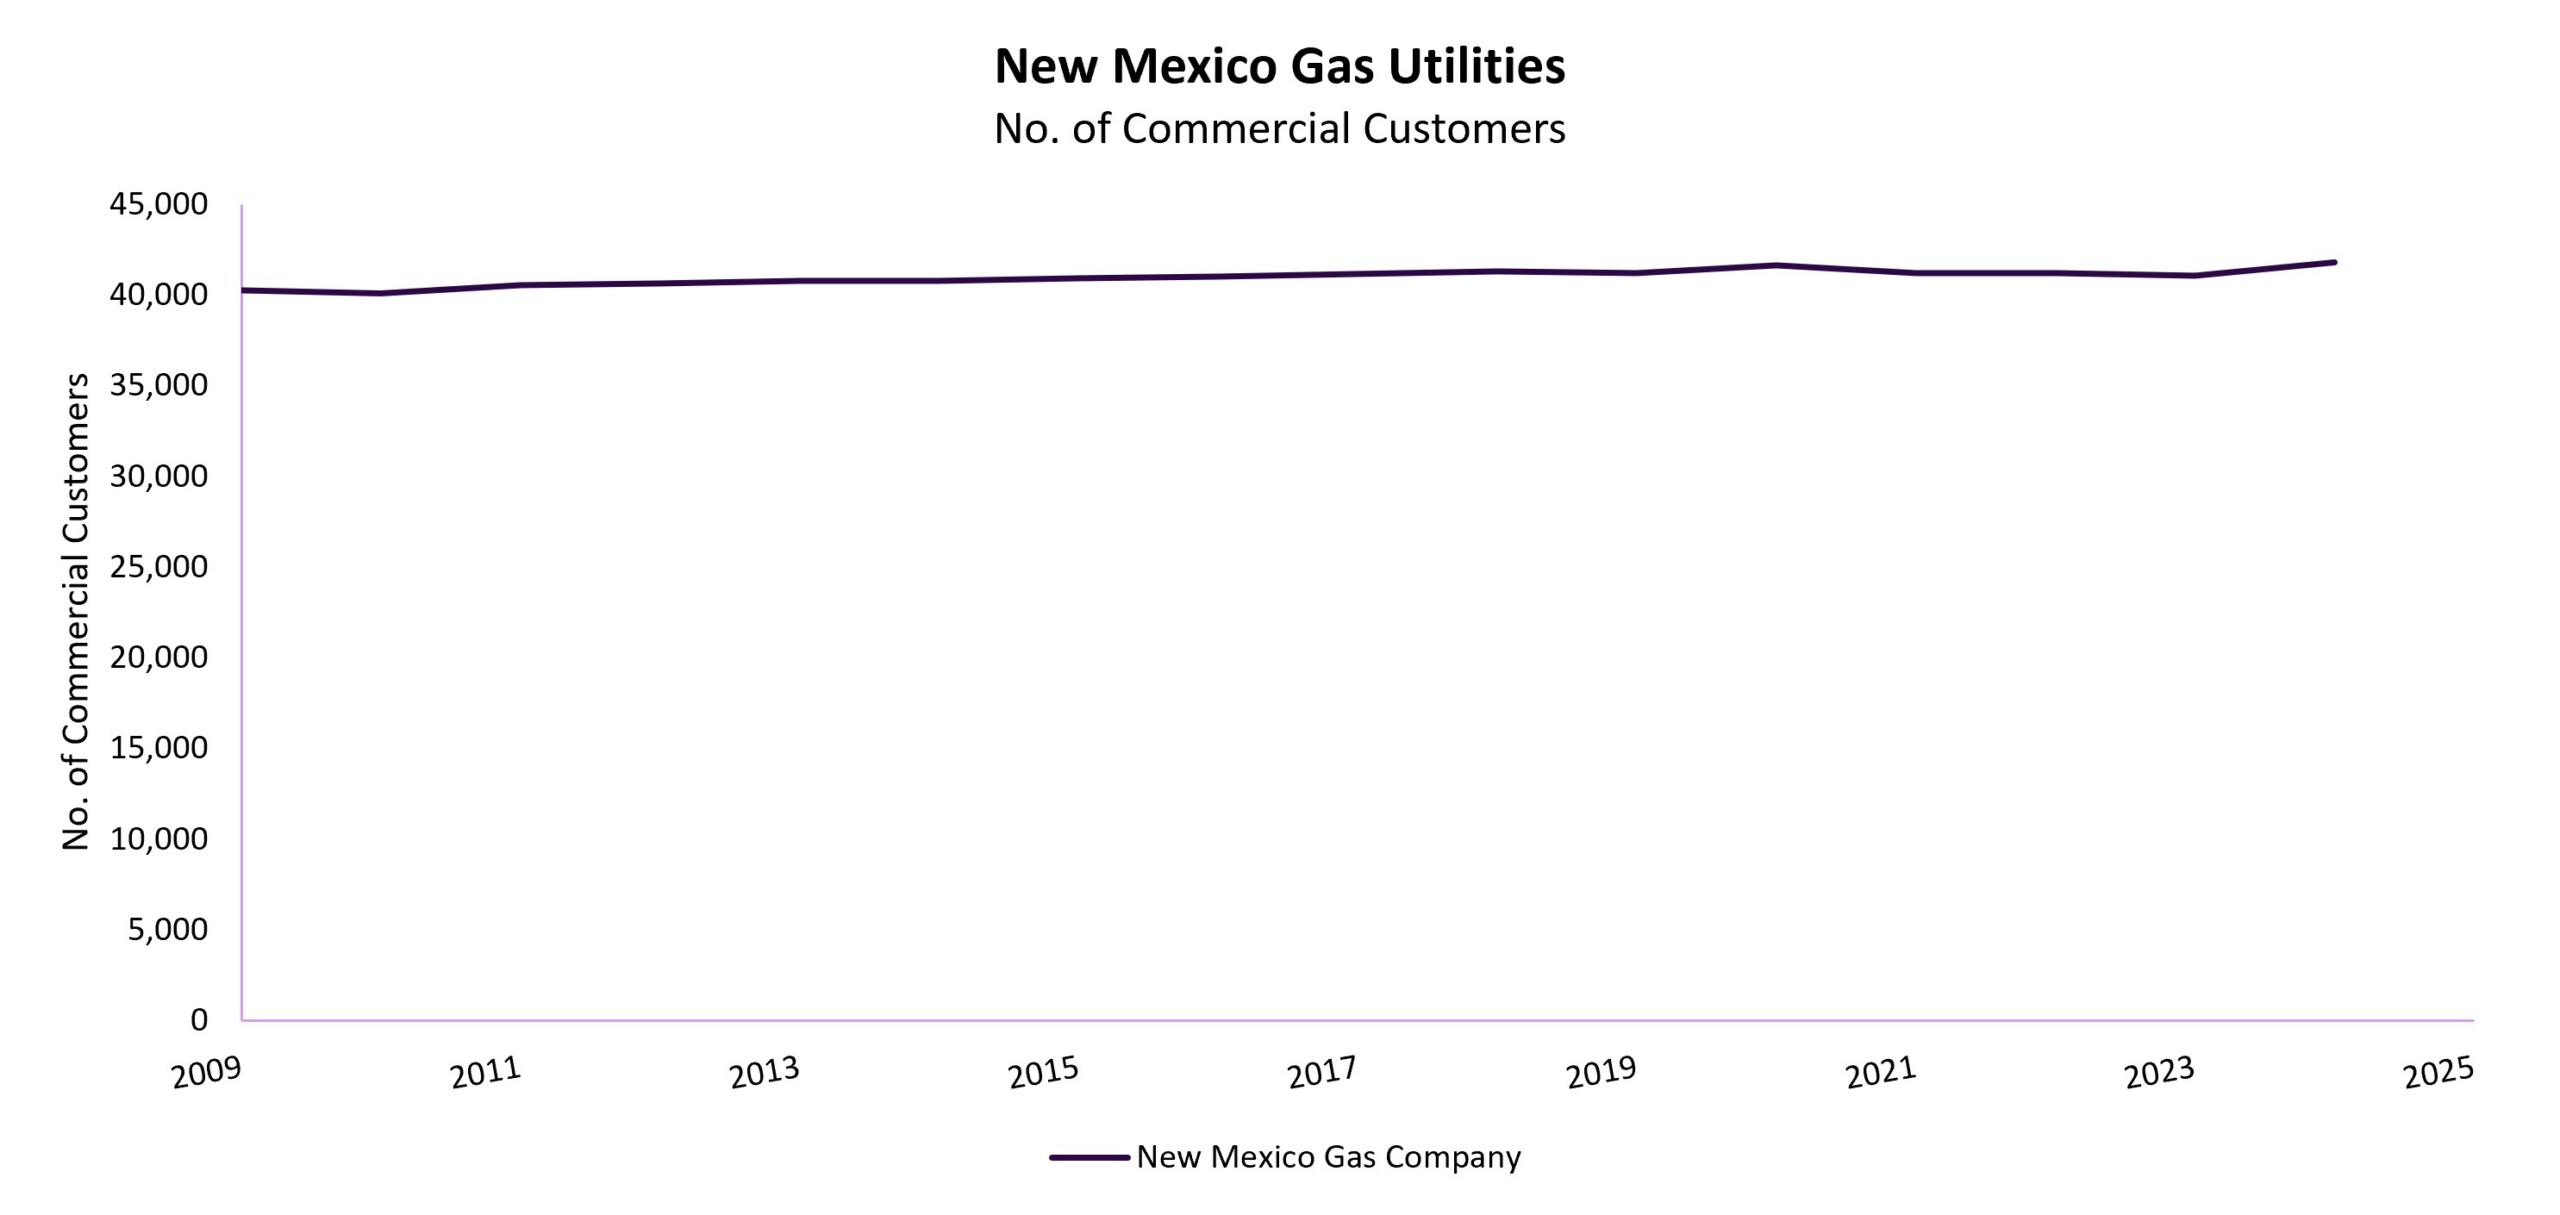
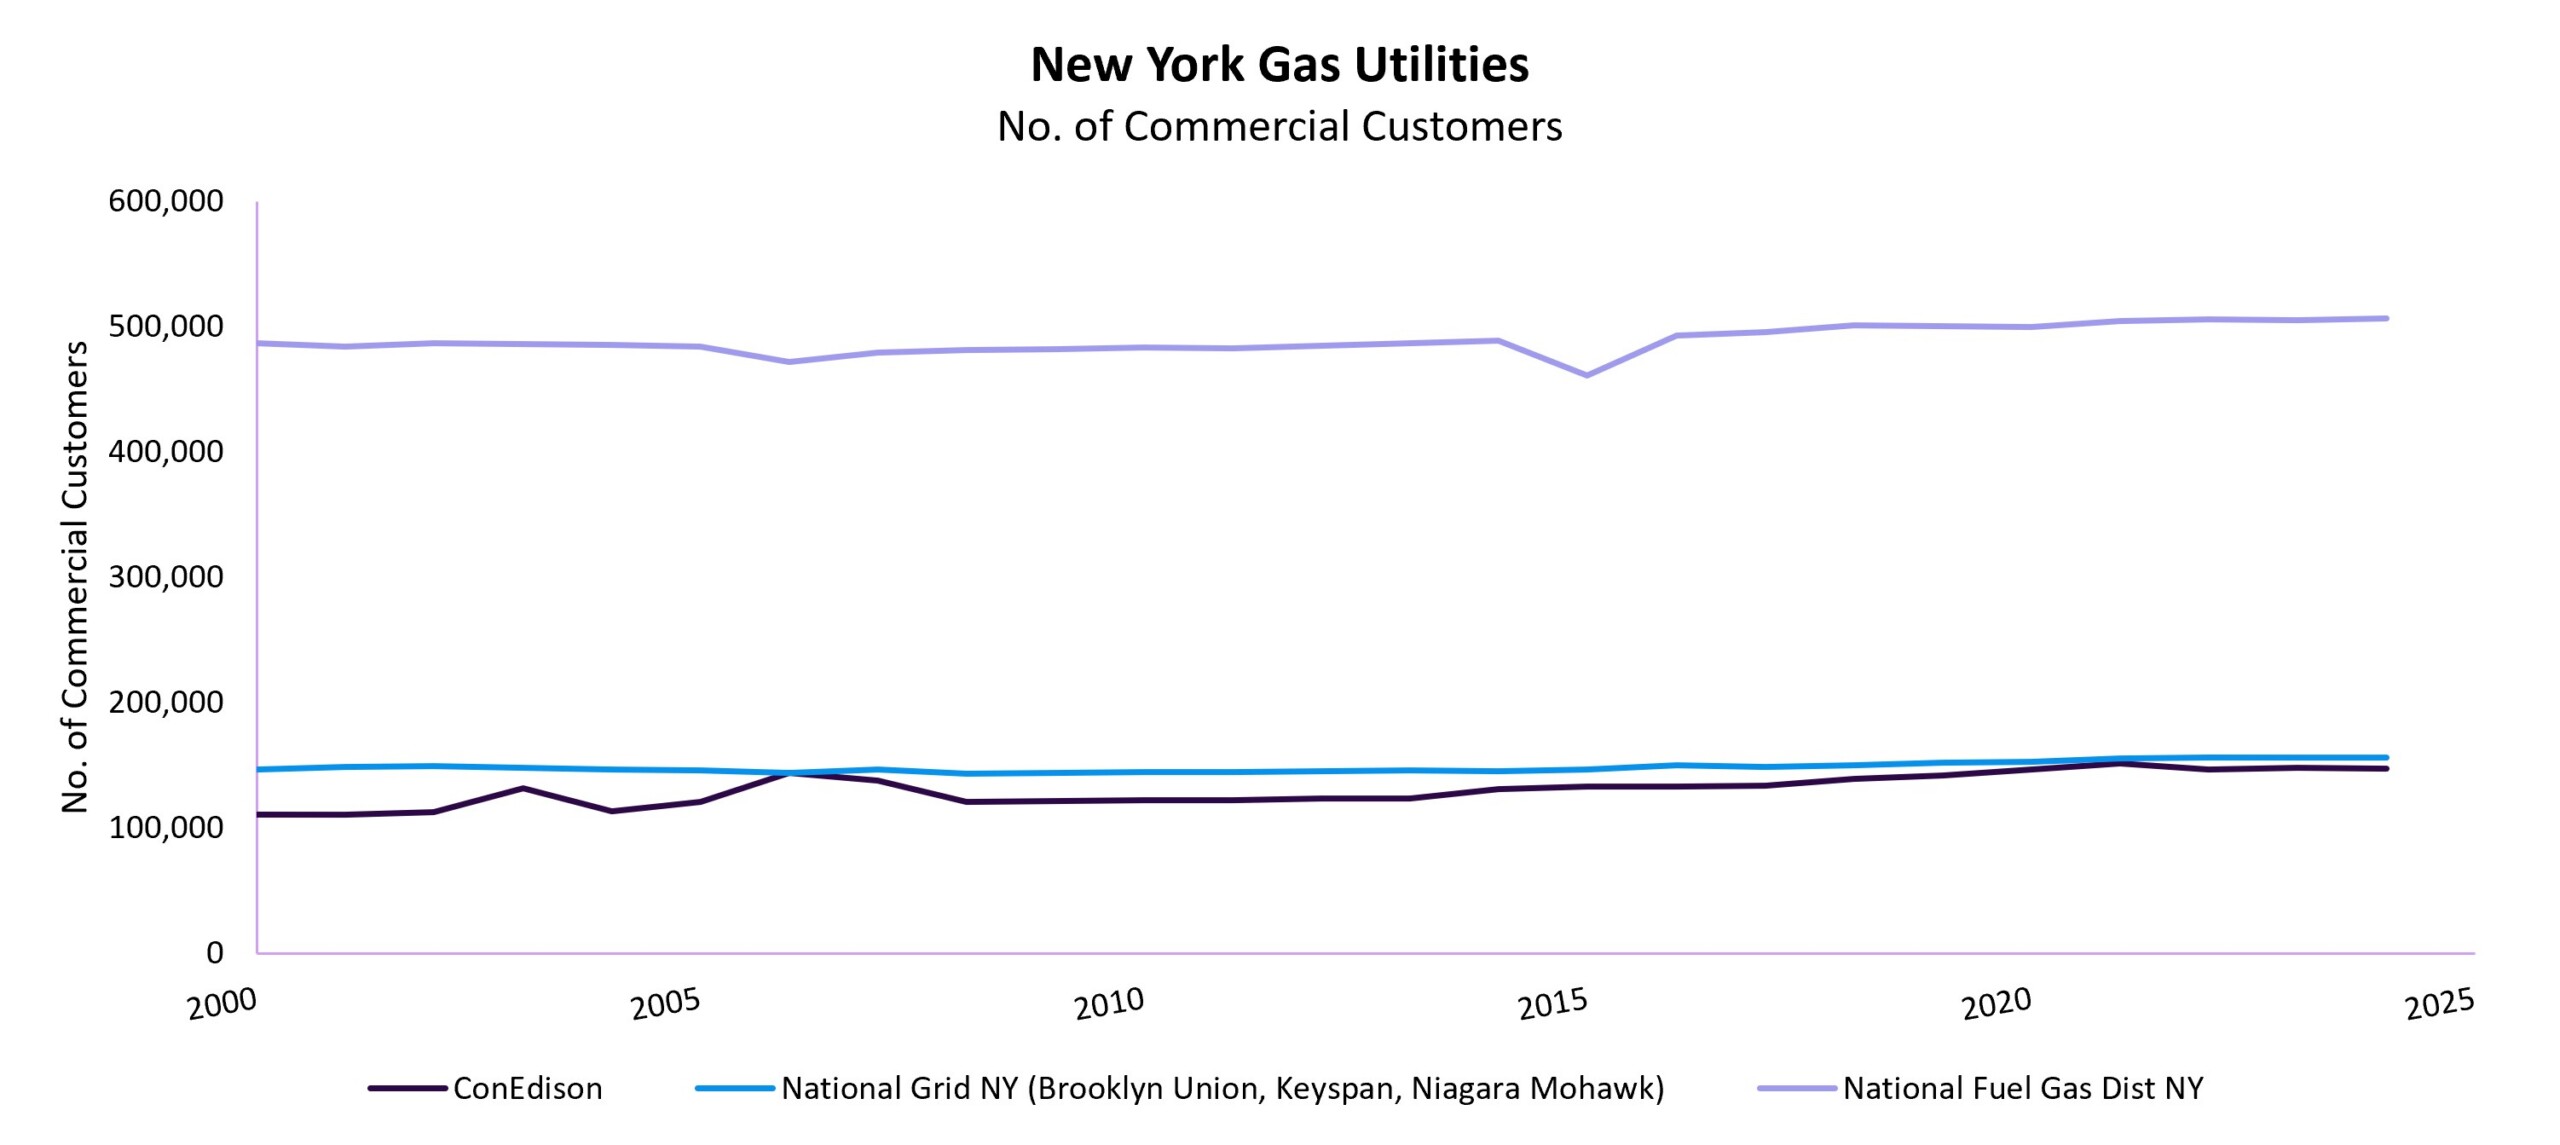
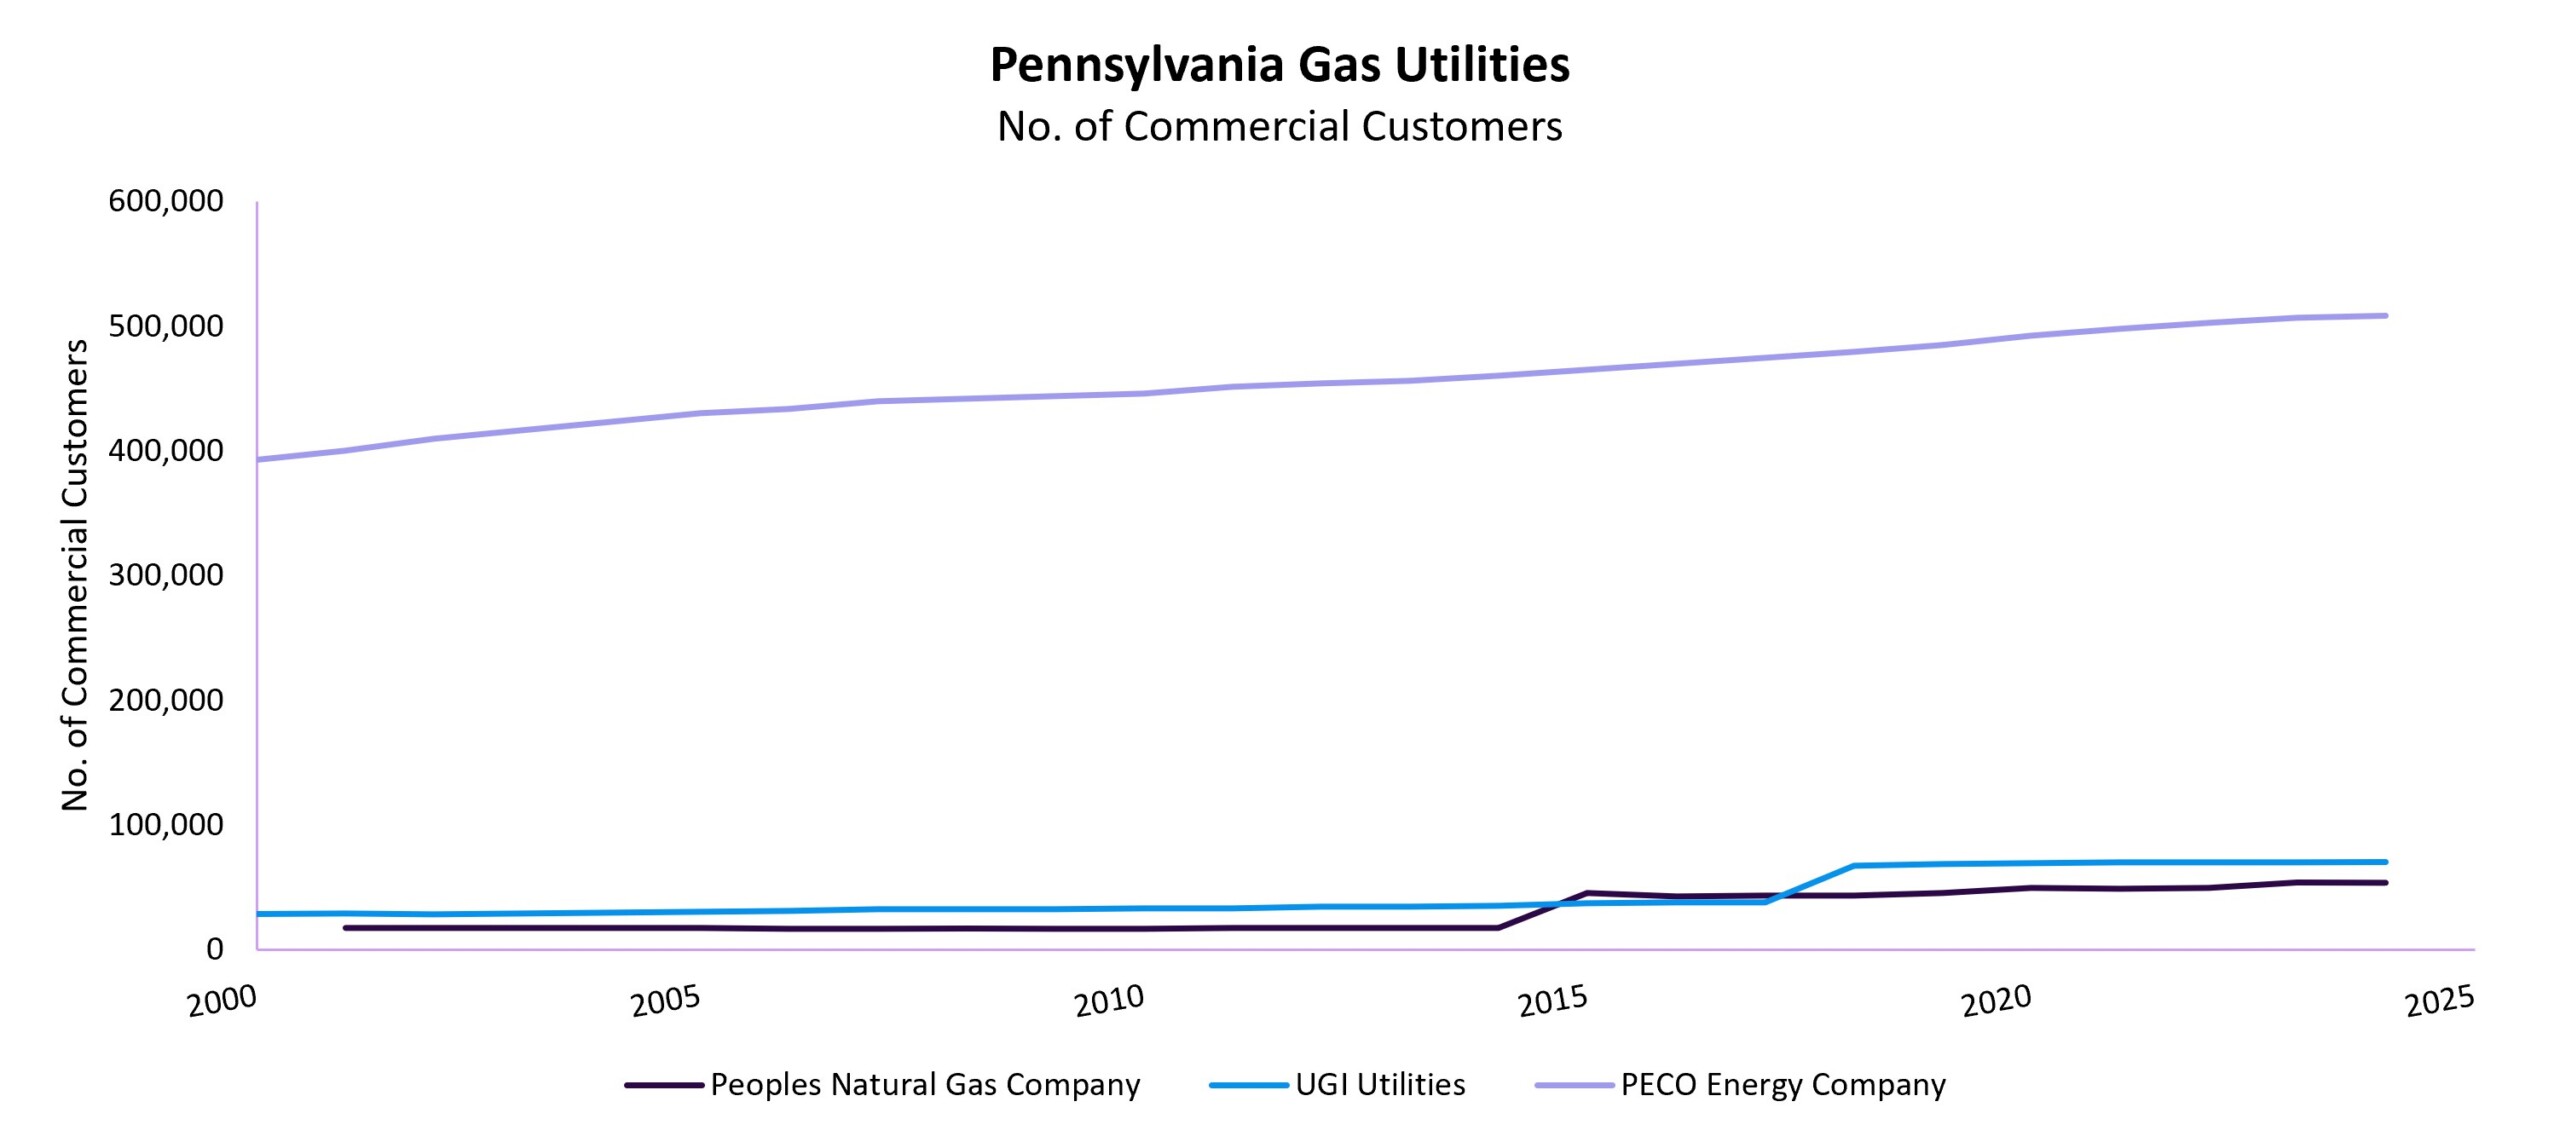
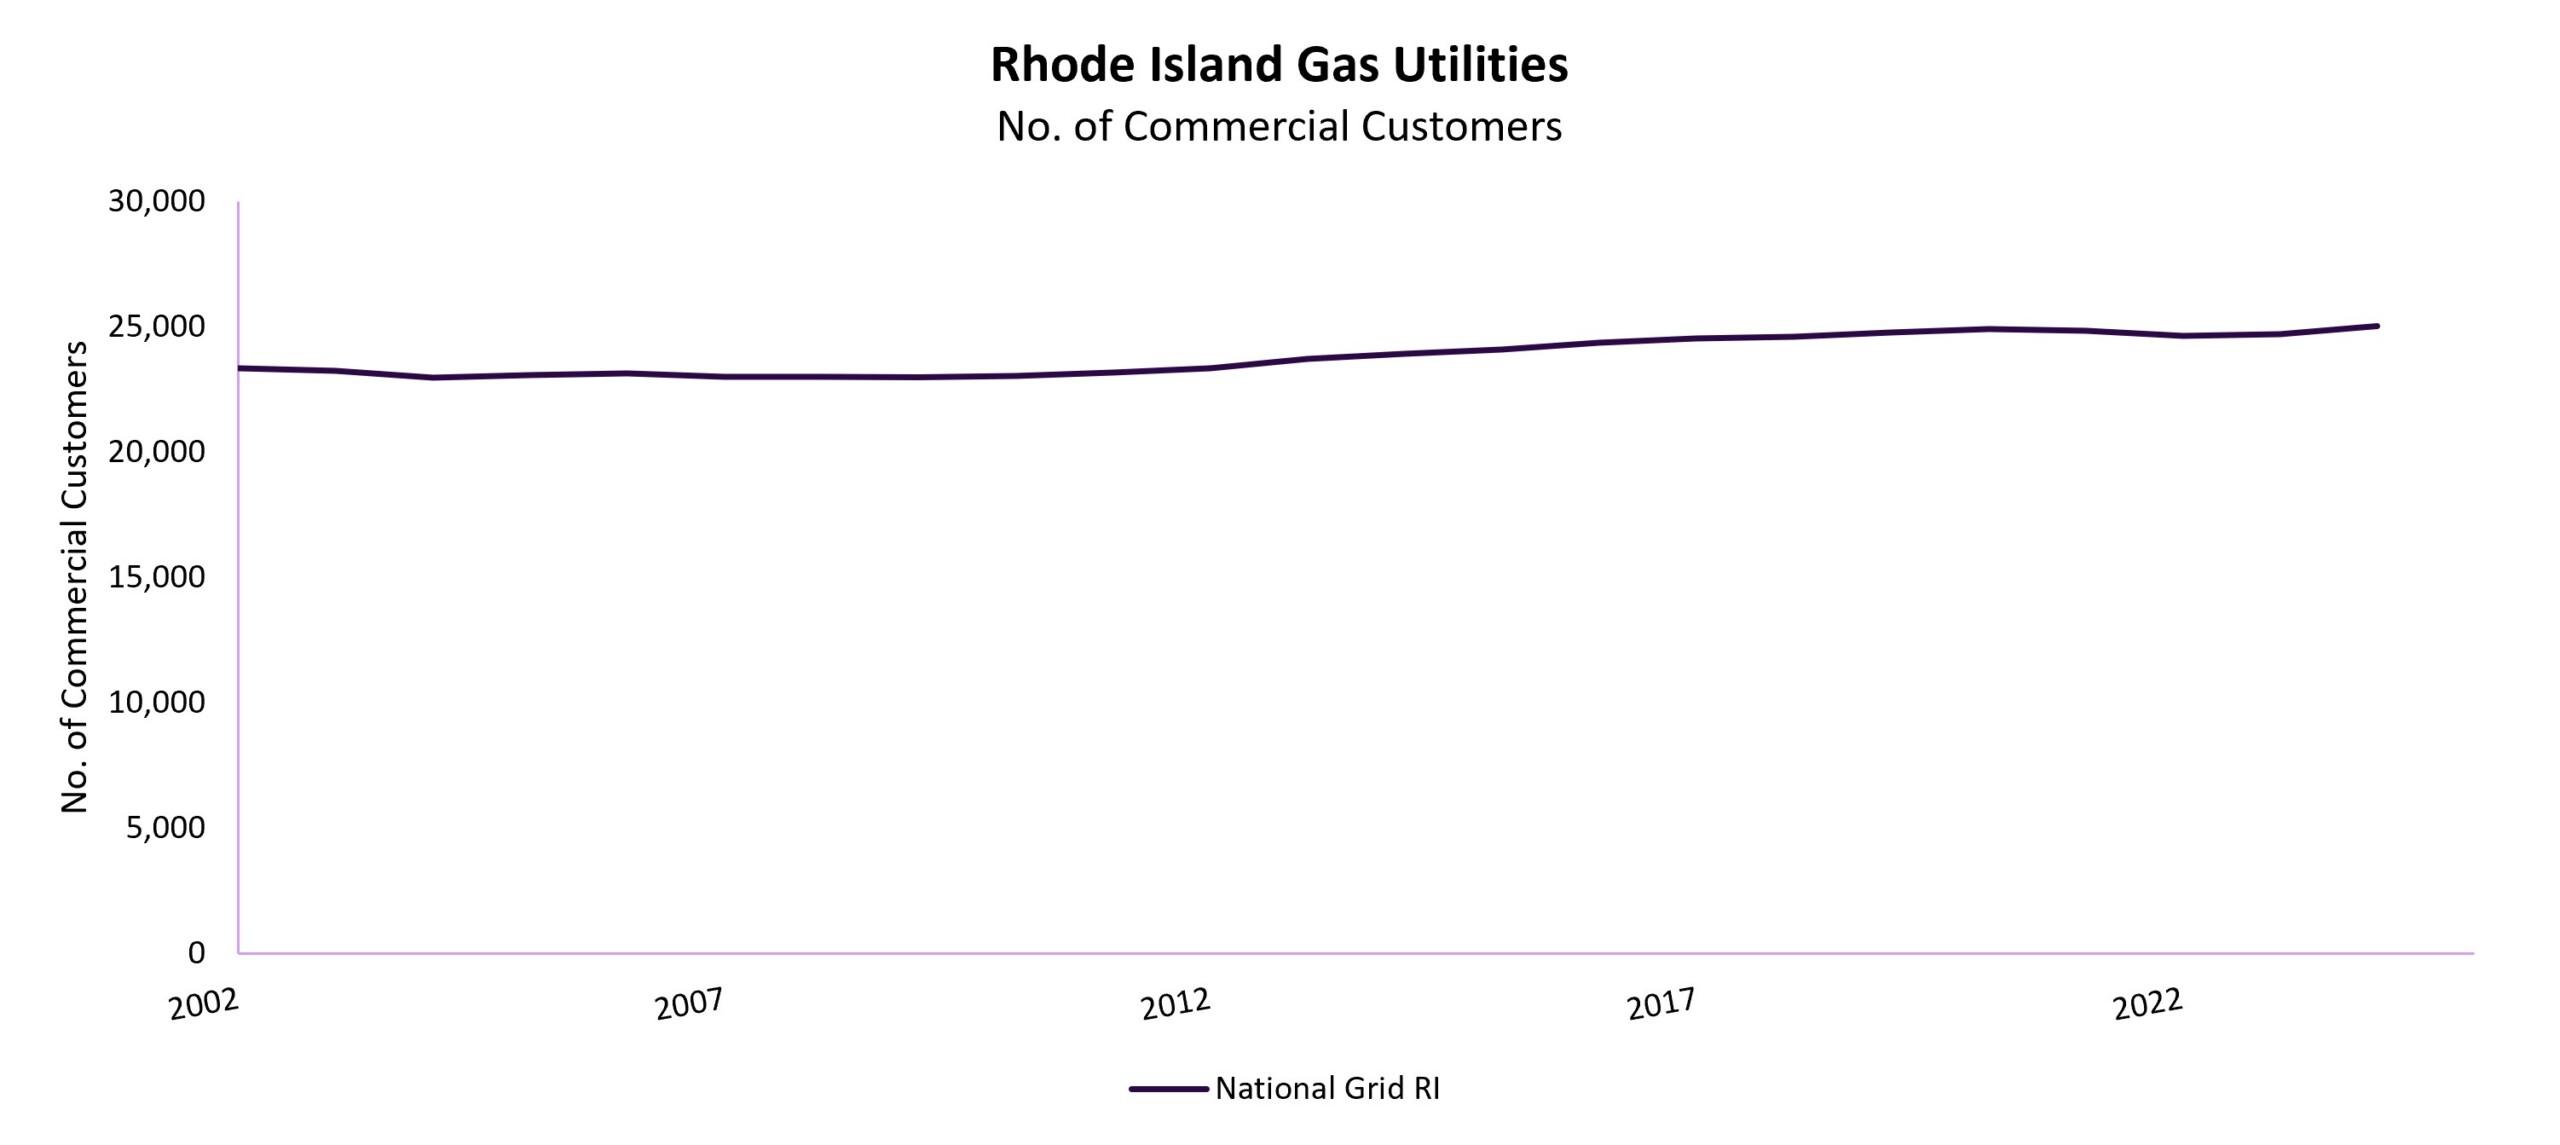
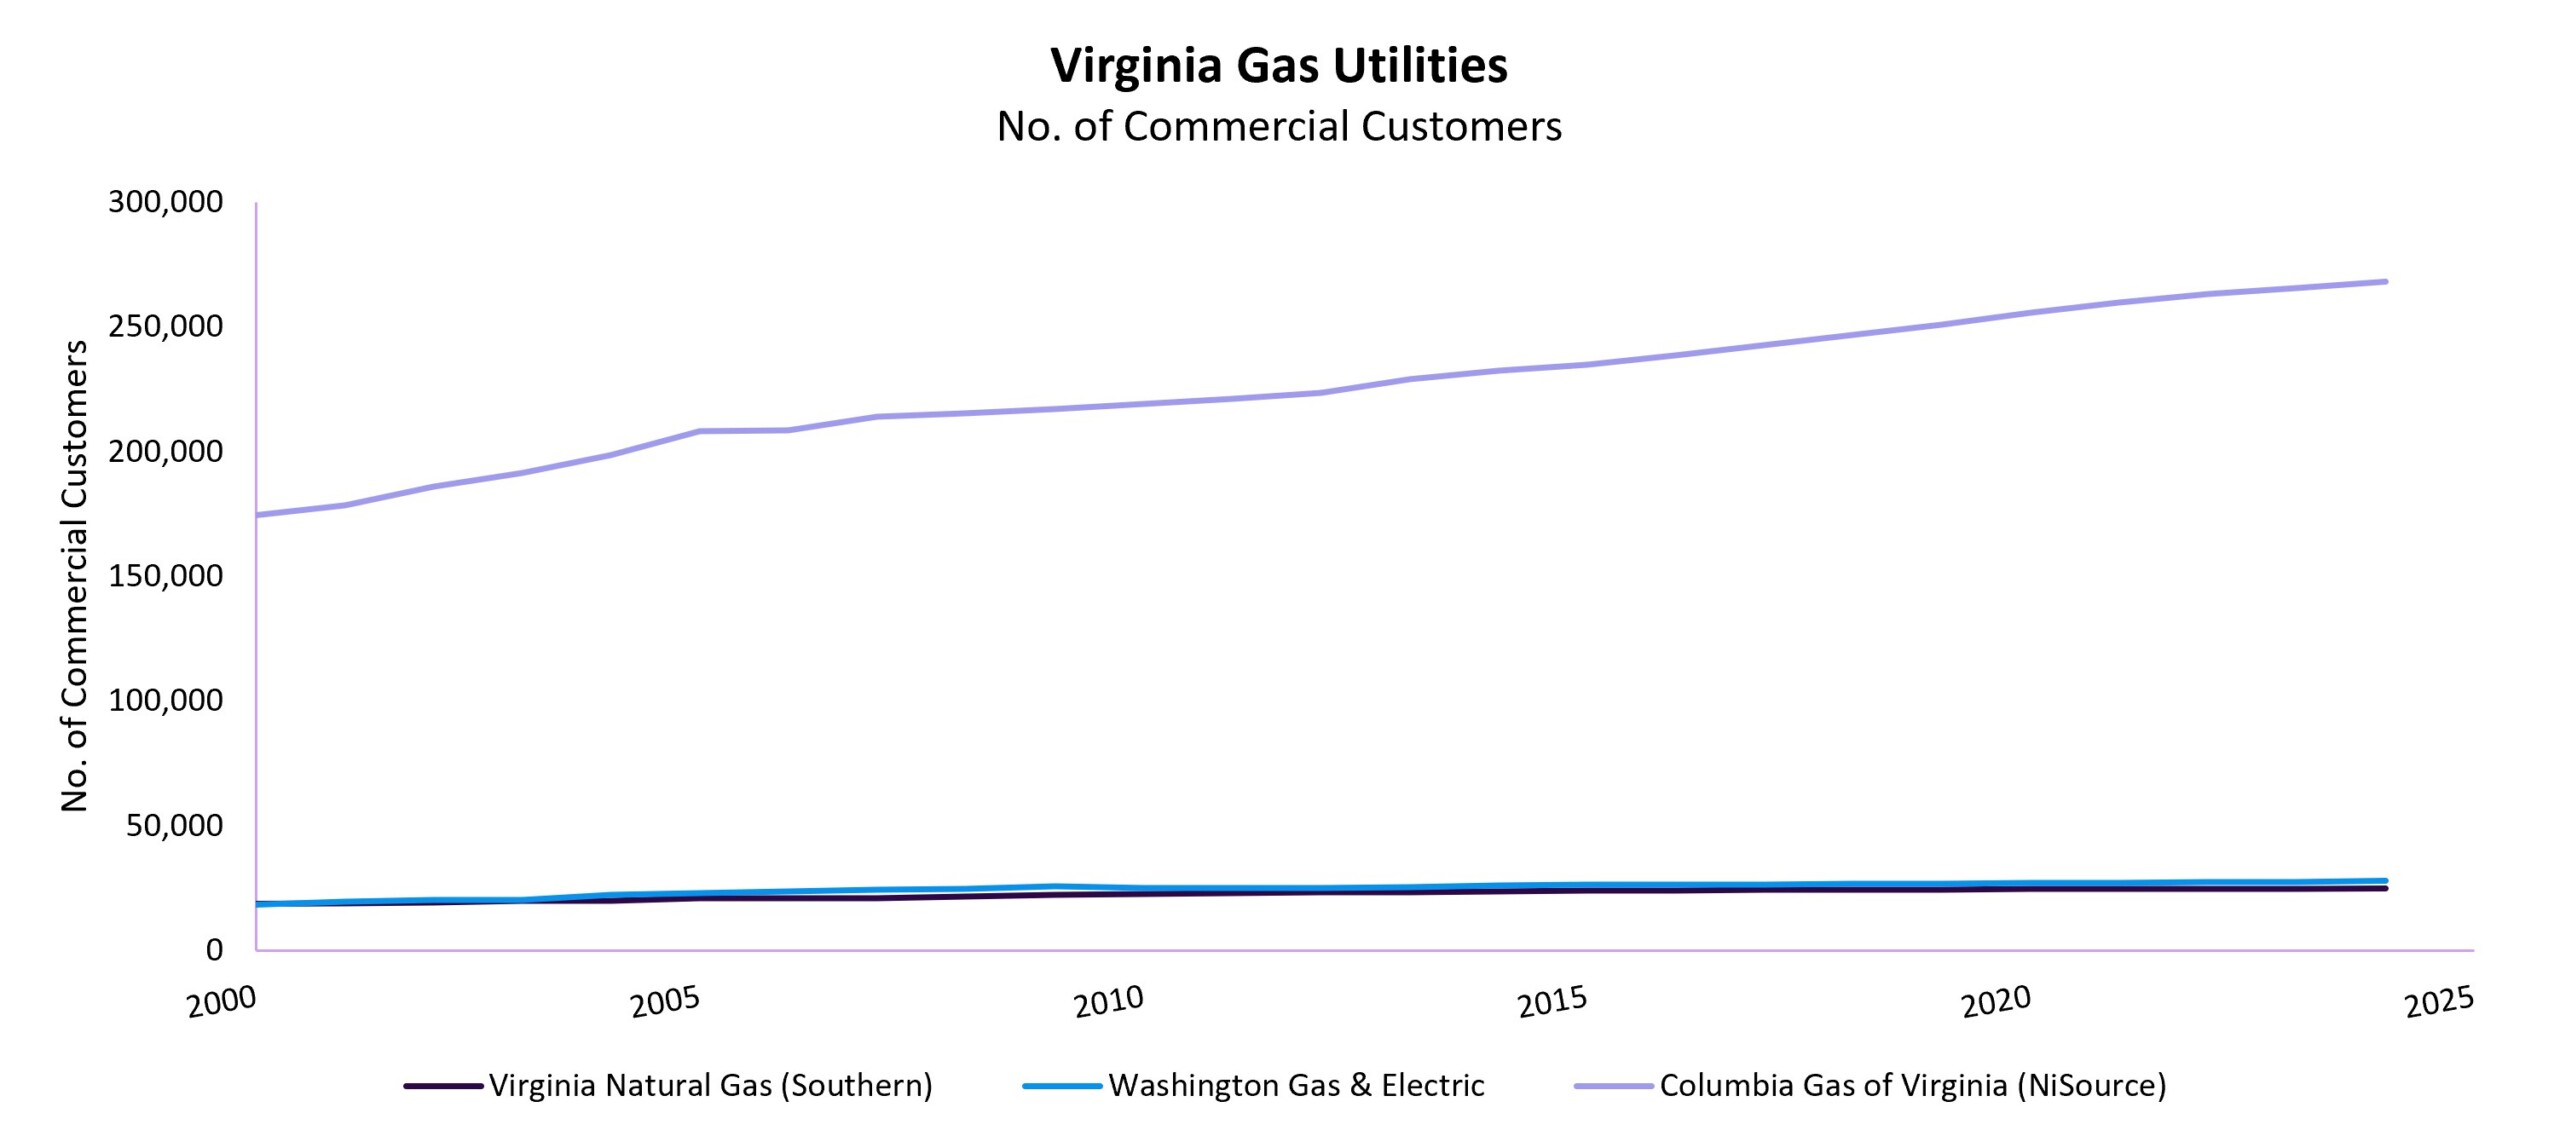
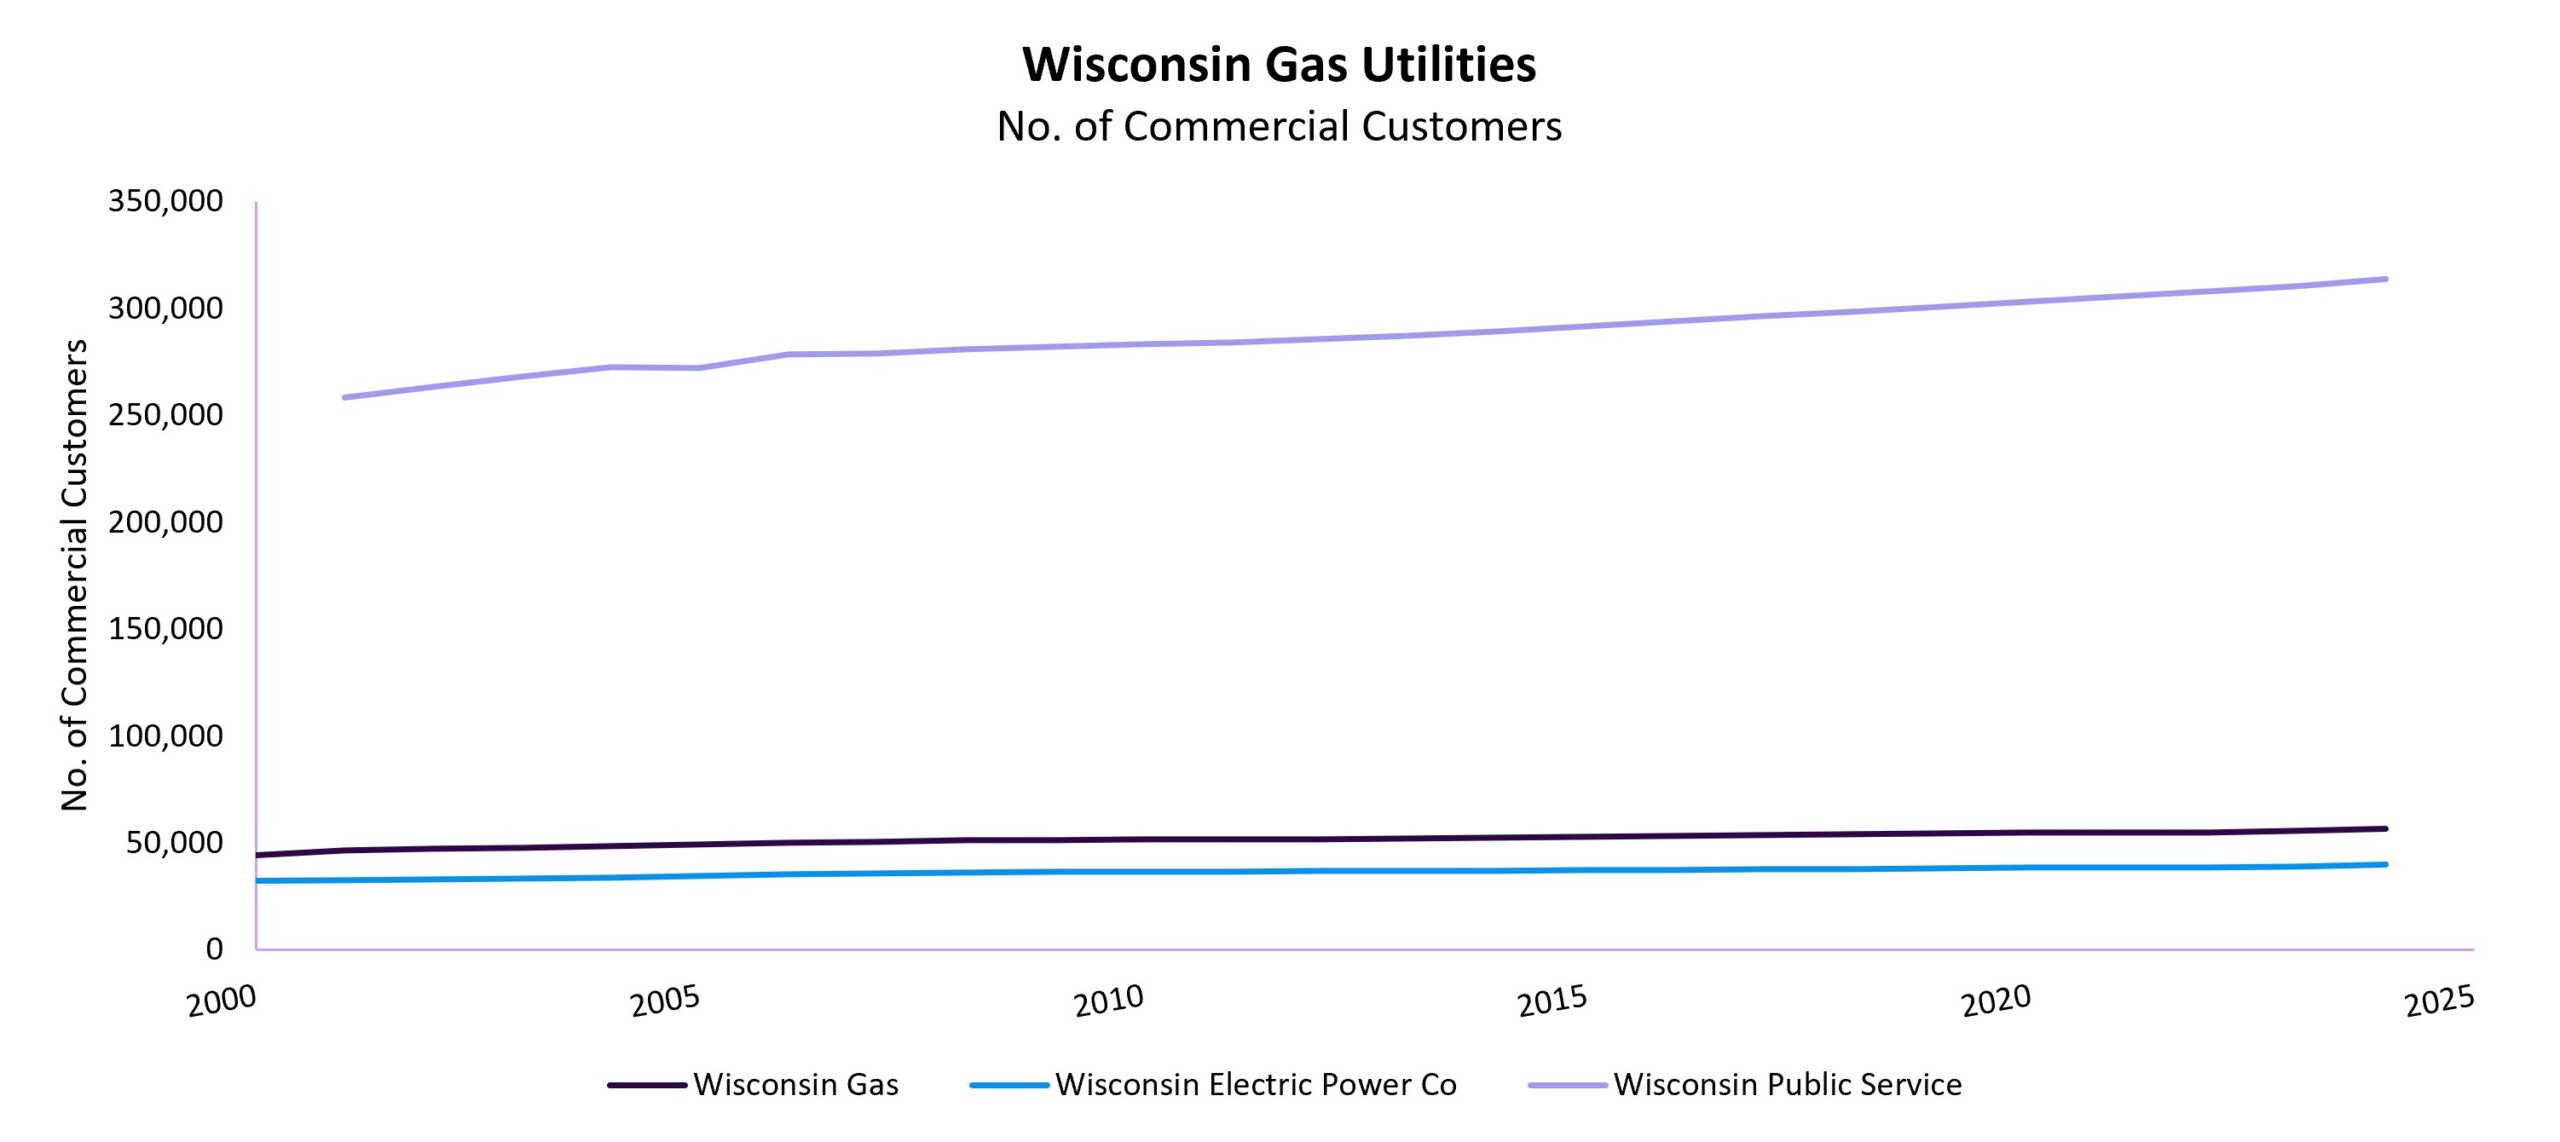
Most states that have seen increases in residential customer counts have also seen an increase in the number of commercial customers. And similar to the residential side, Consolidated Edison and PSEG in New York and New Jersey, respectively, have seen recent downturns in their number of commercial gas customers. Before concluding that this is indicative of a longer-term trend, United plans to wait for another year or two of data.
Commercial Gas Sales per Customer
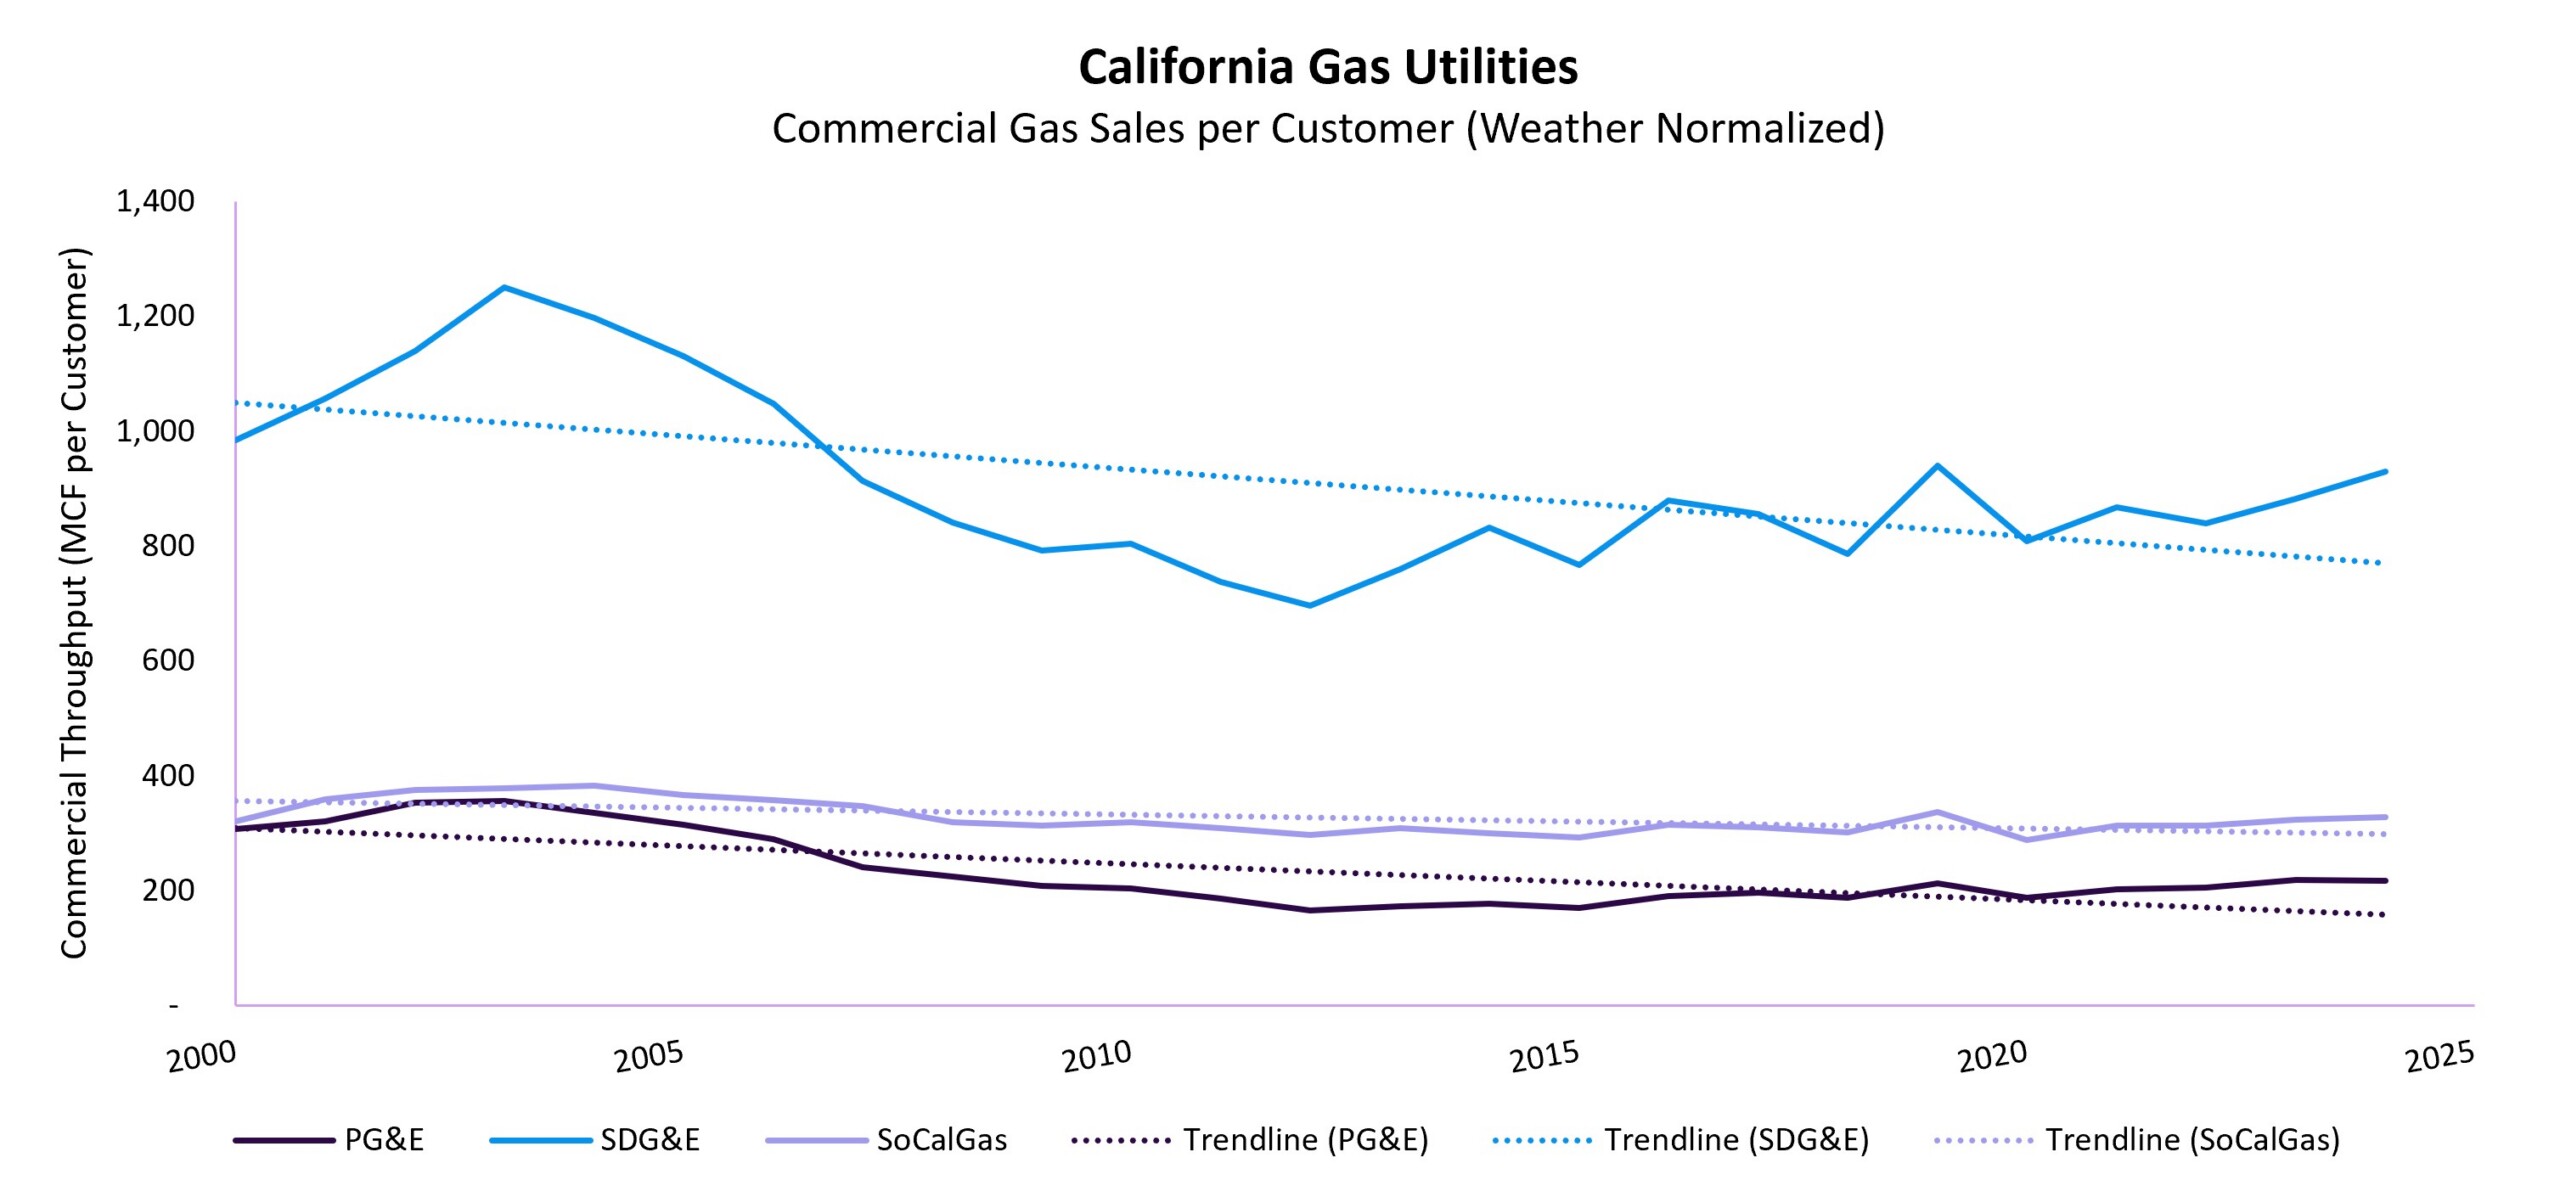
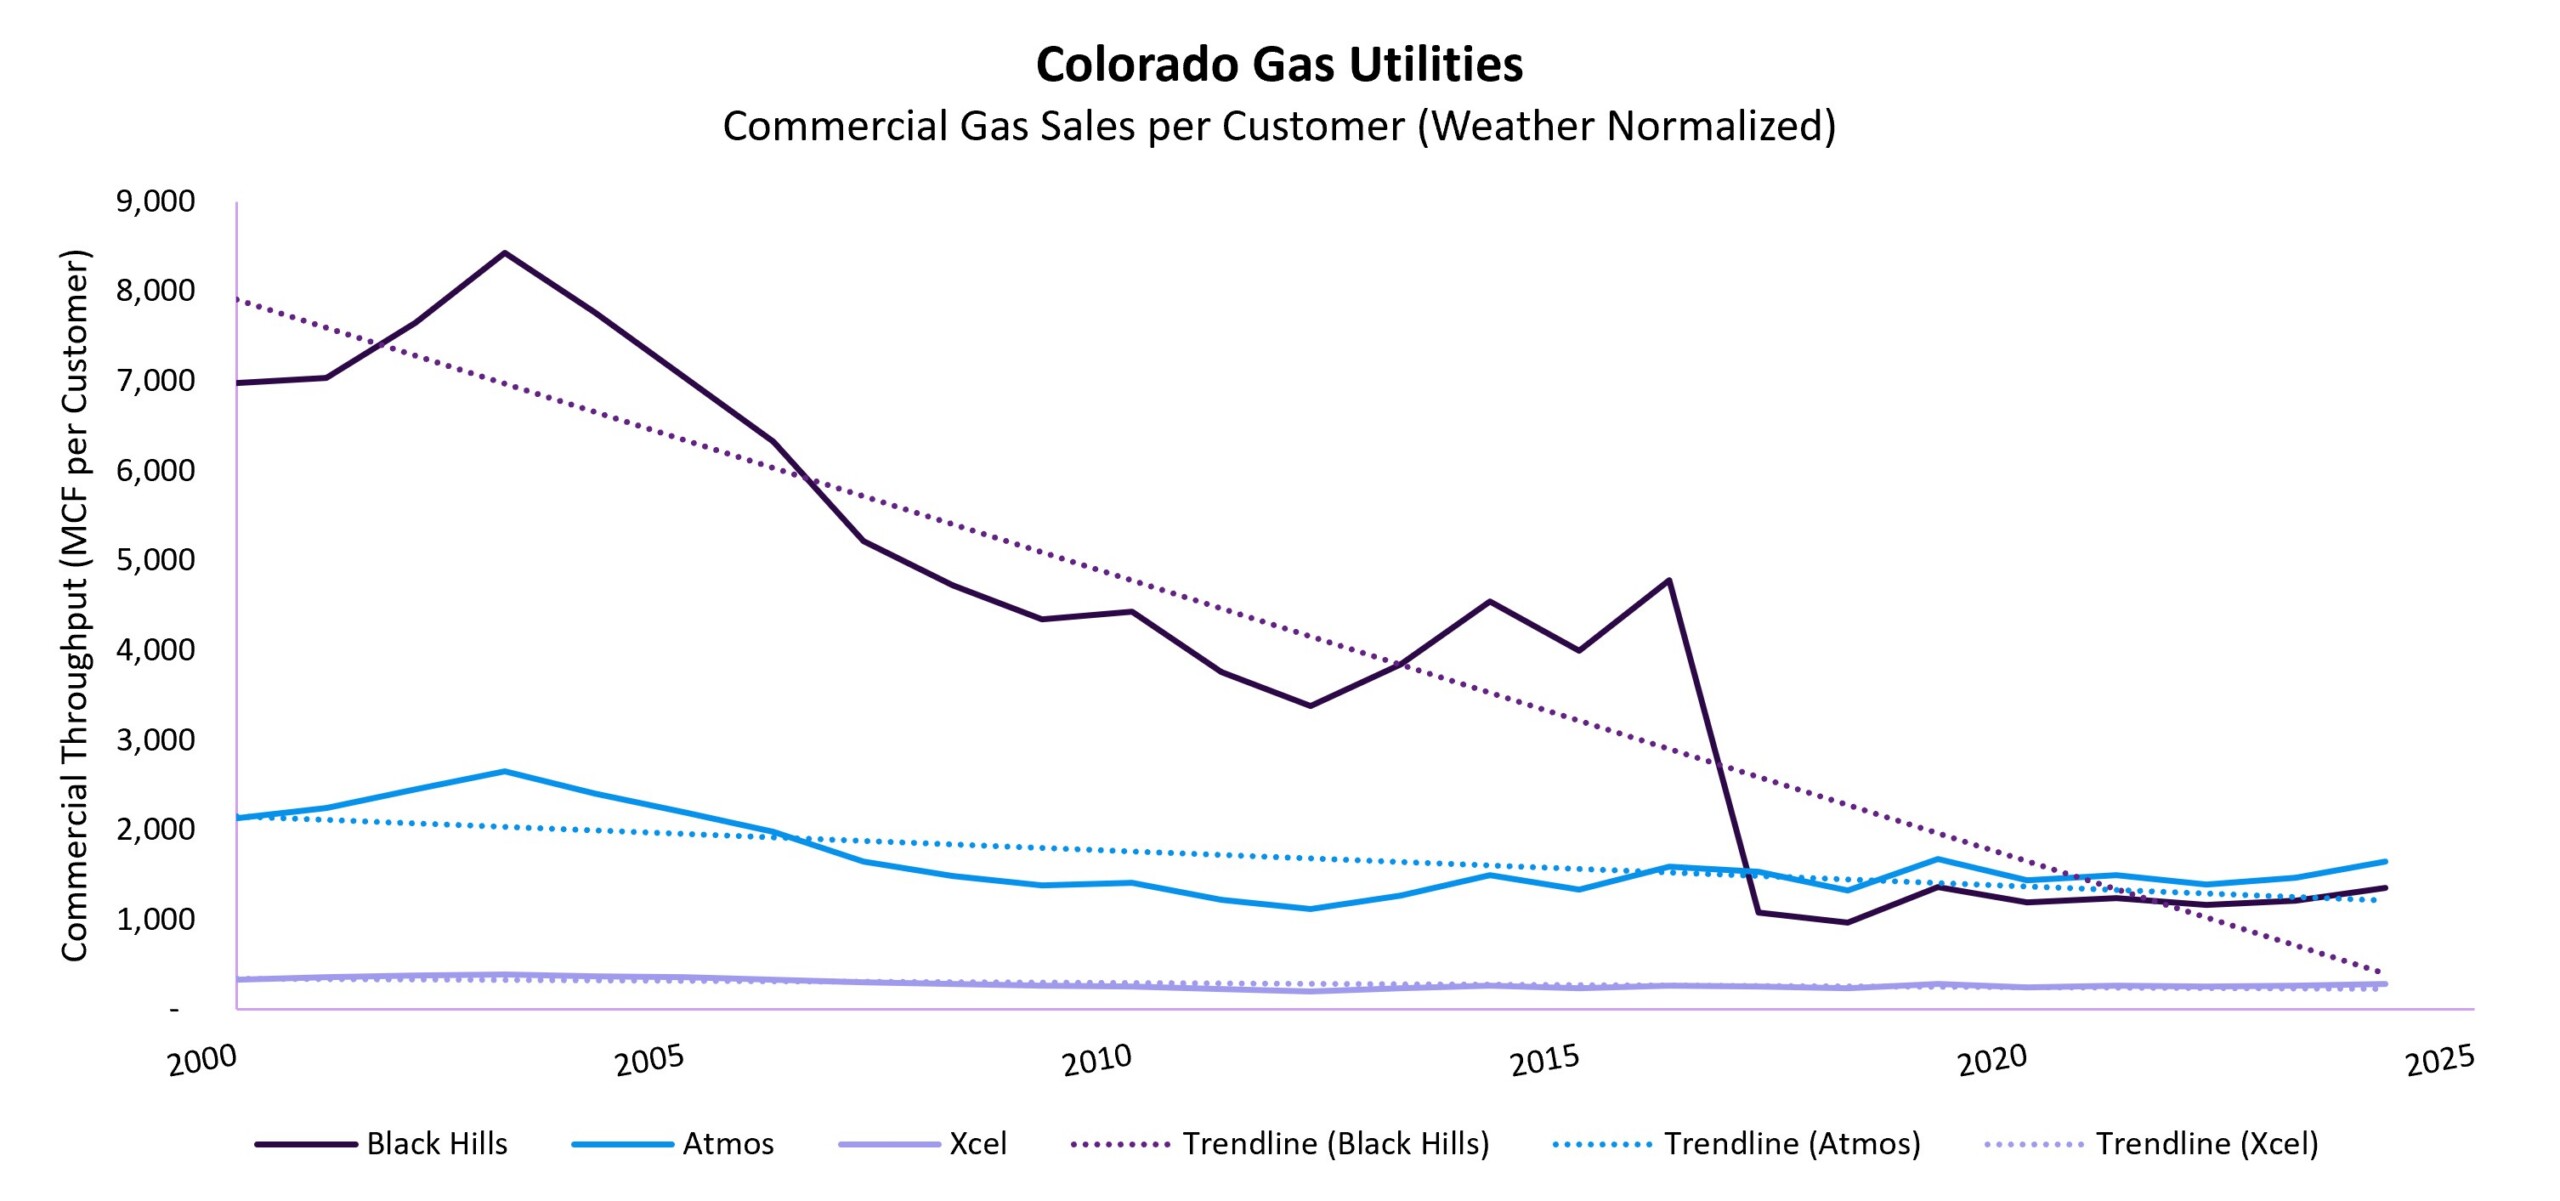
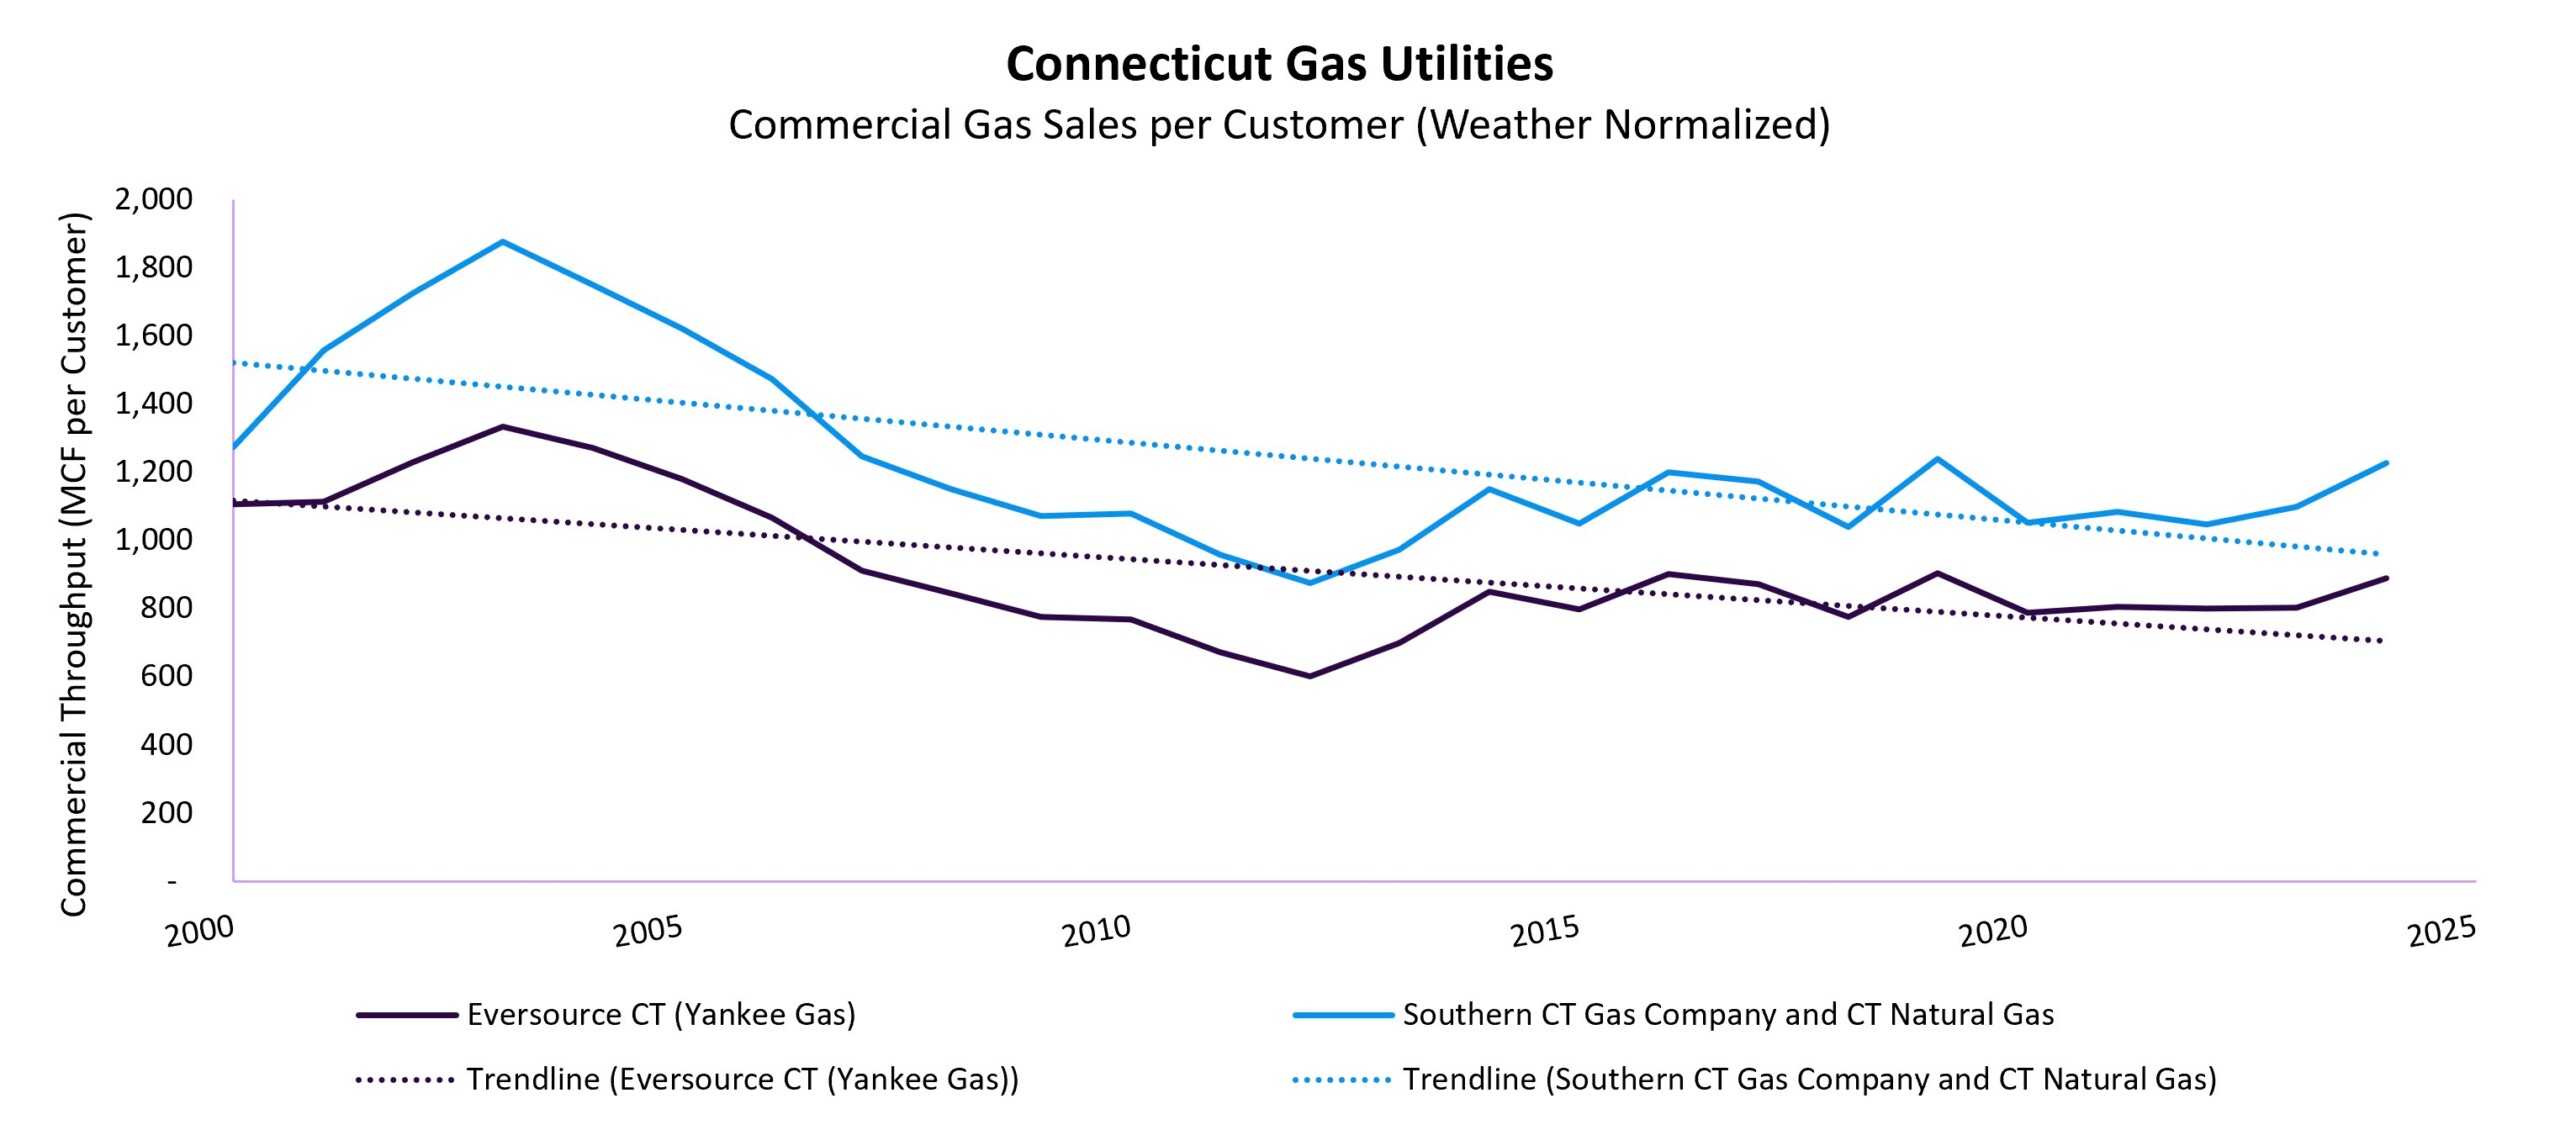
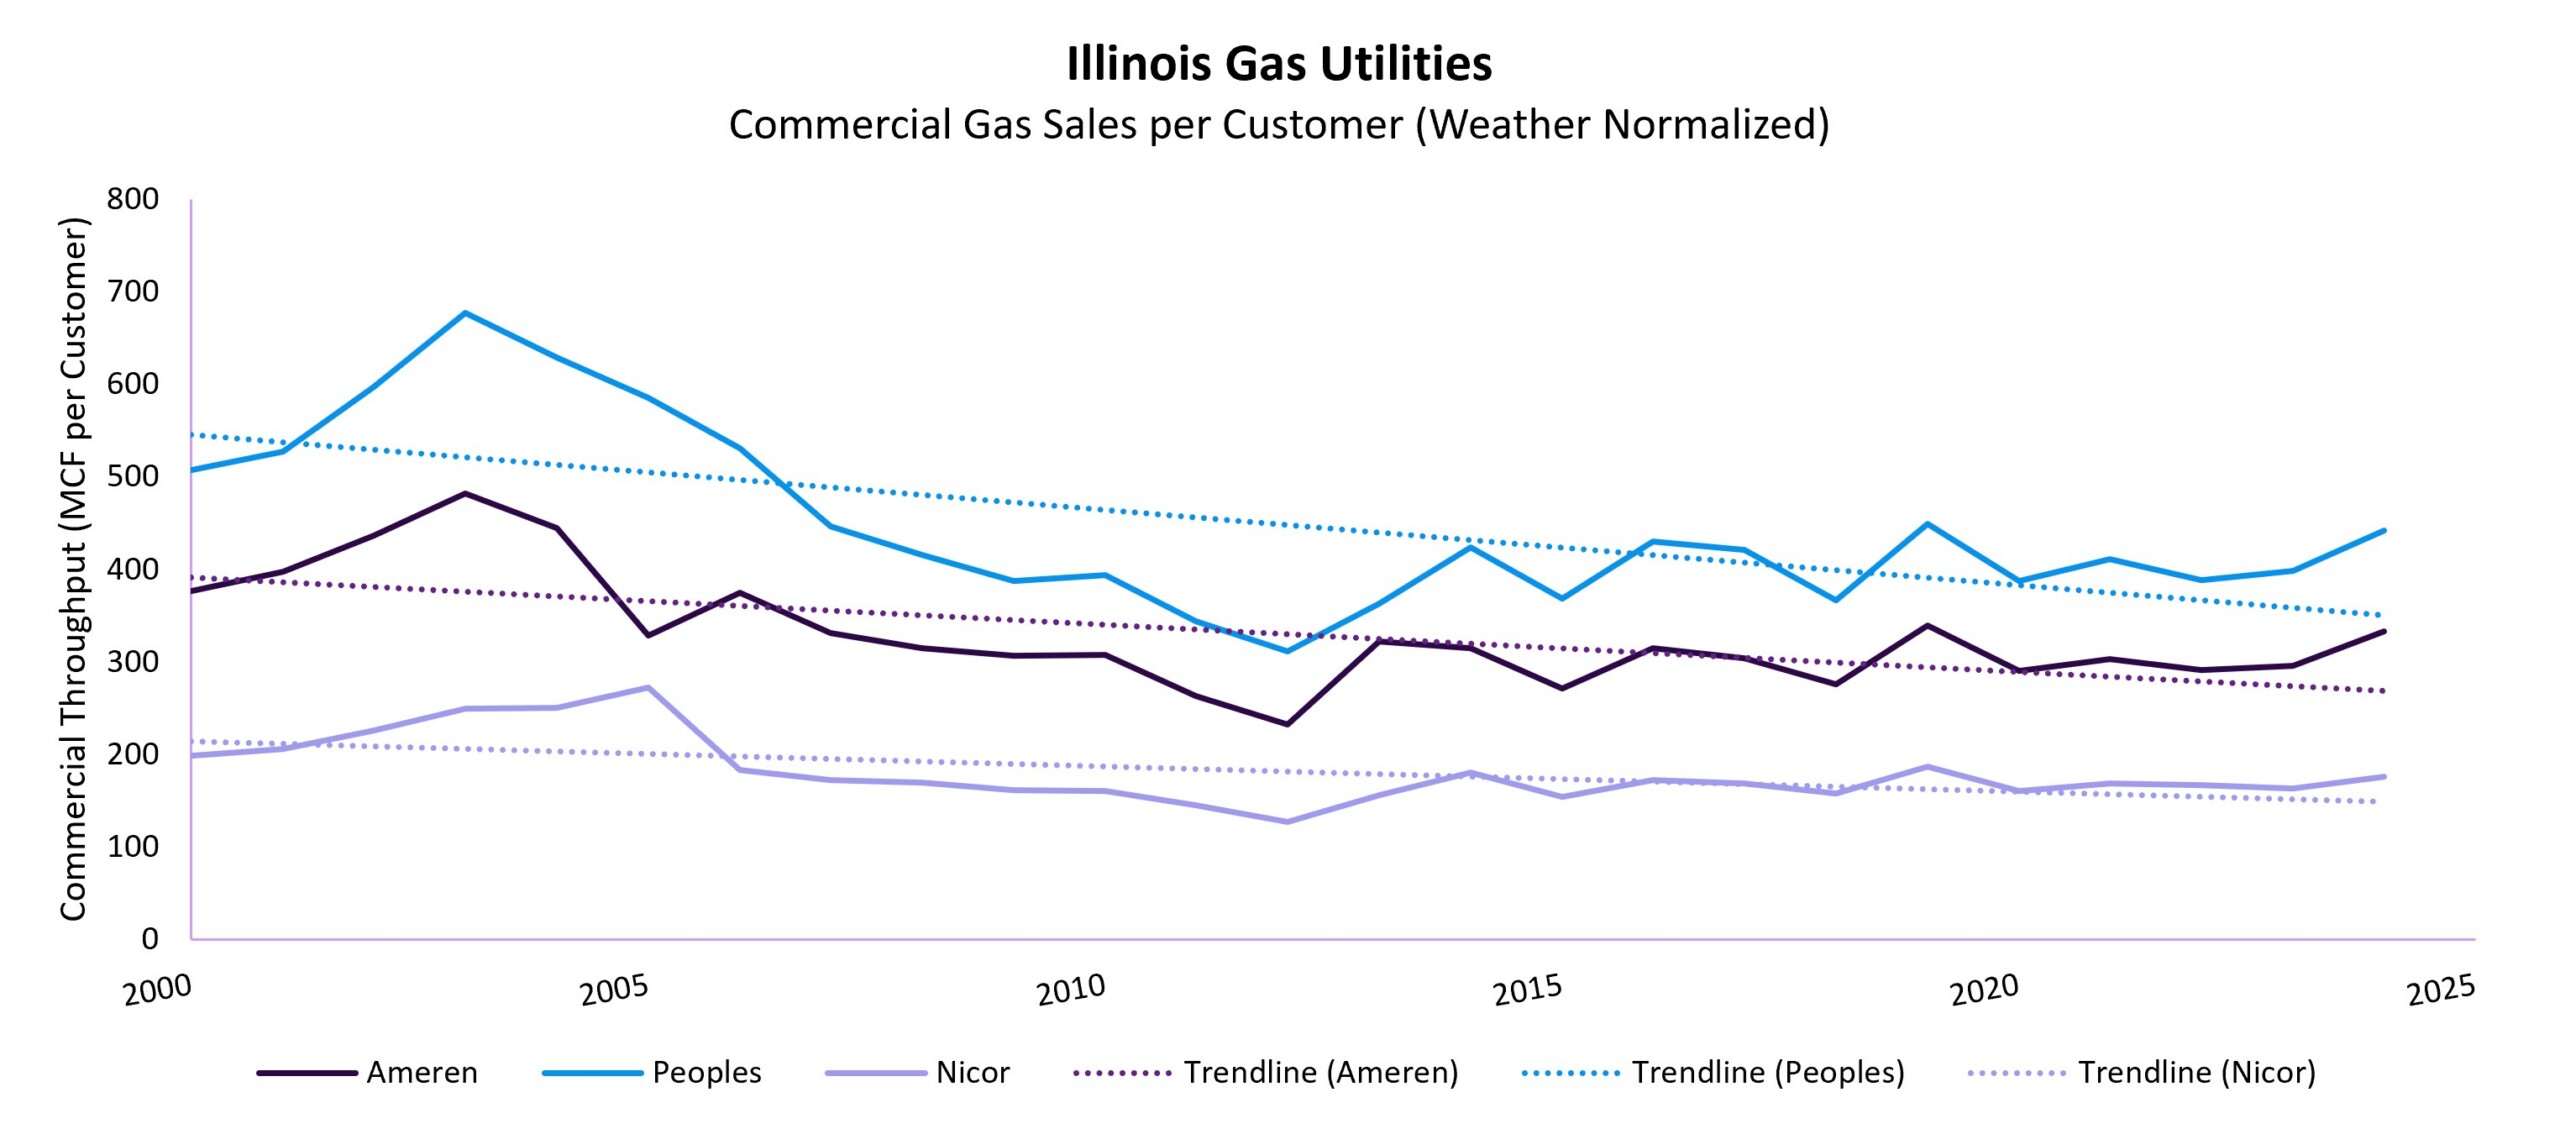
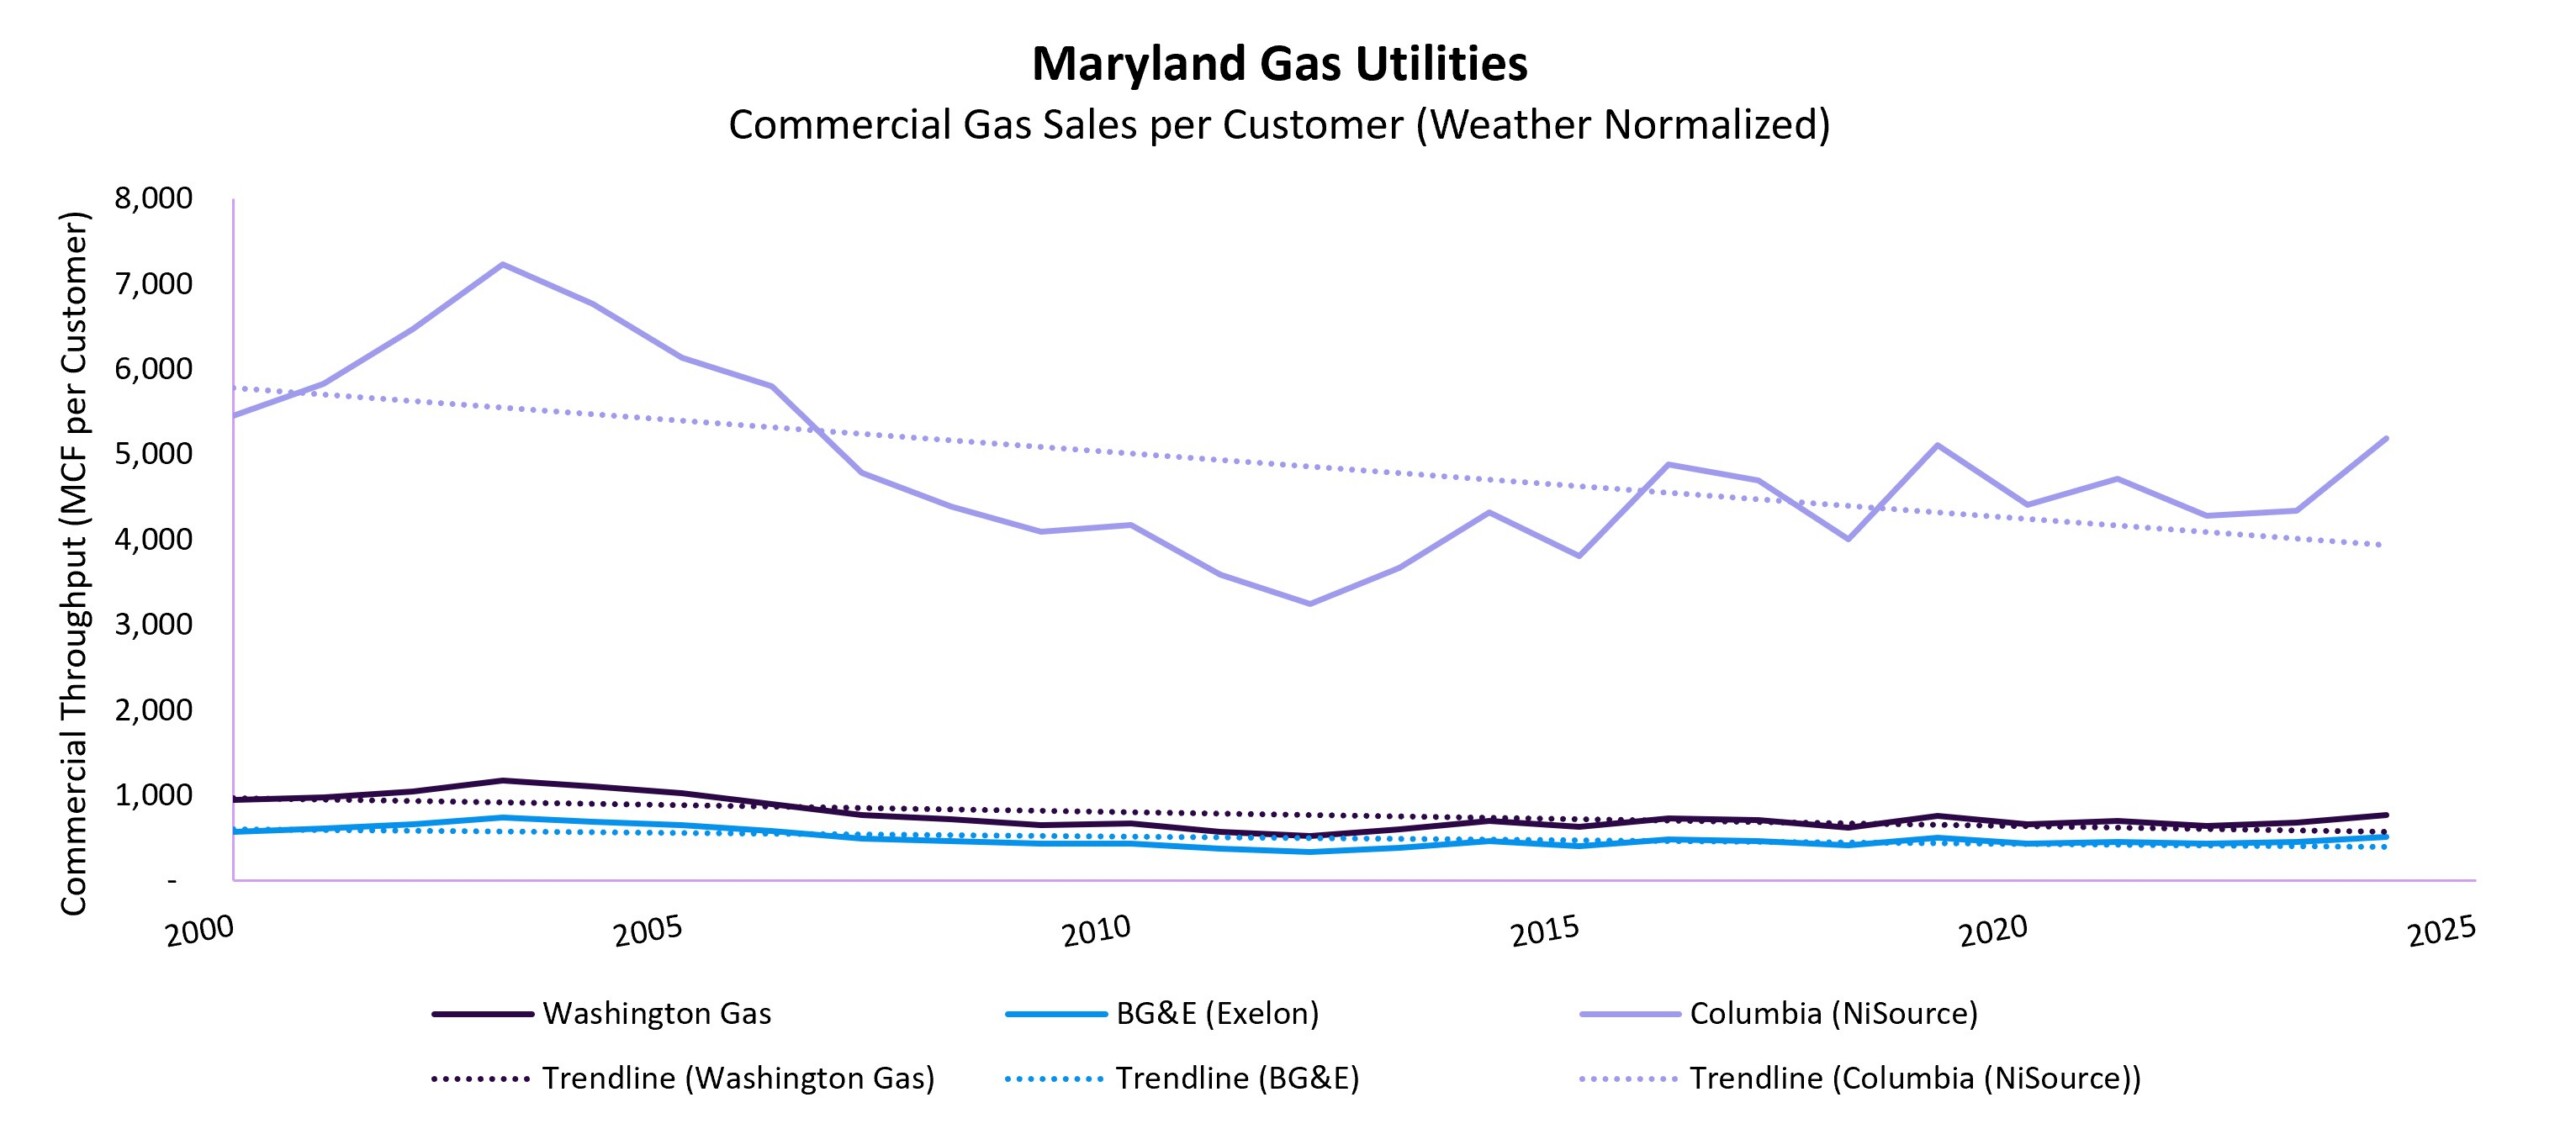
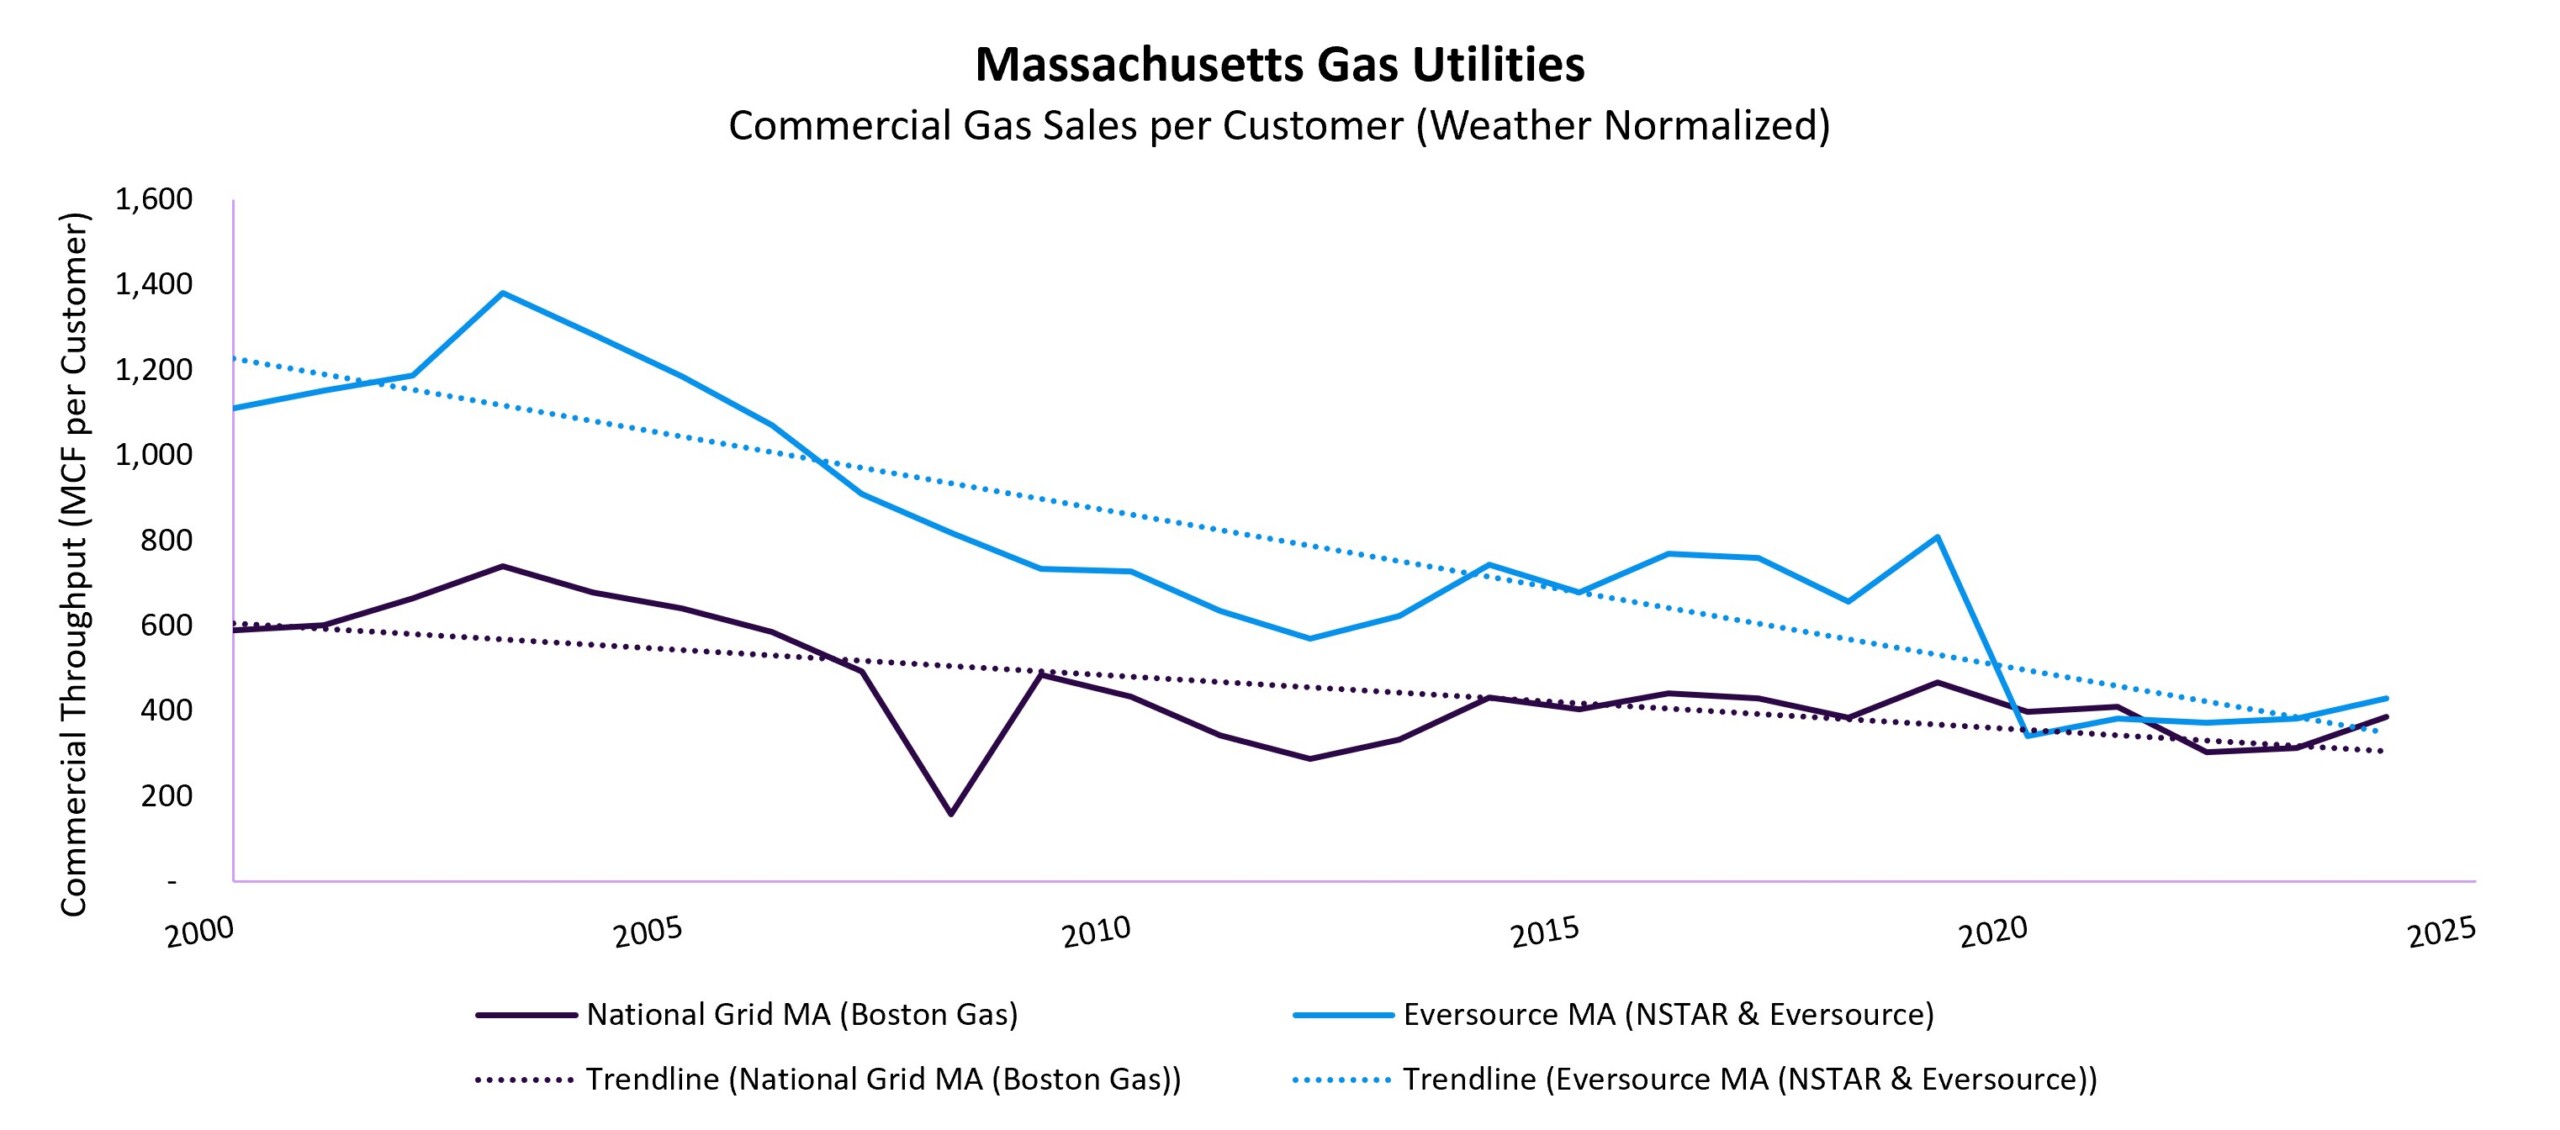
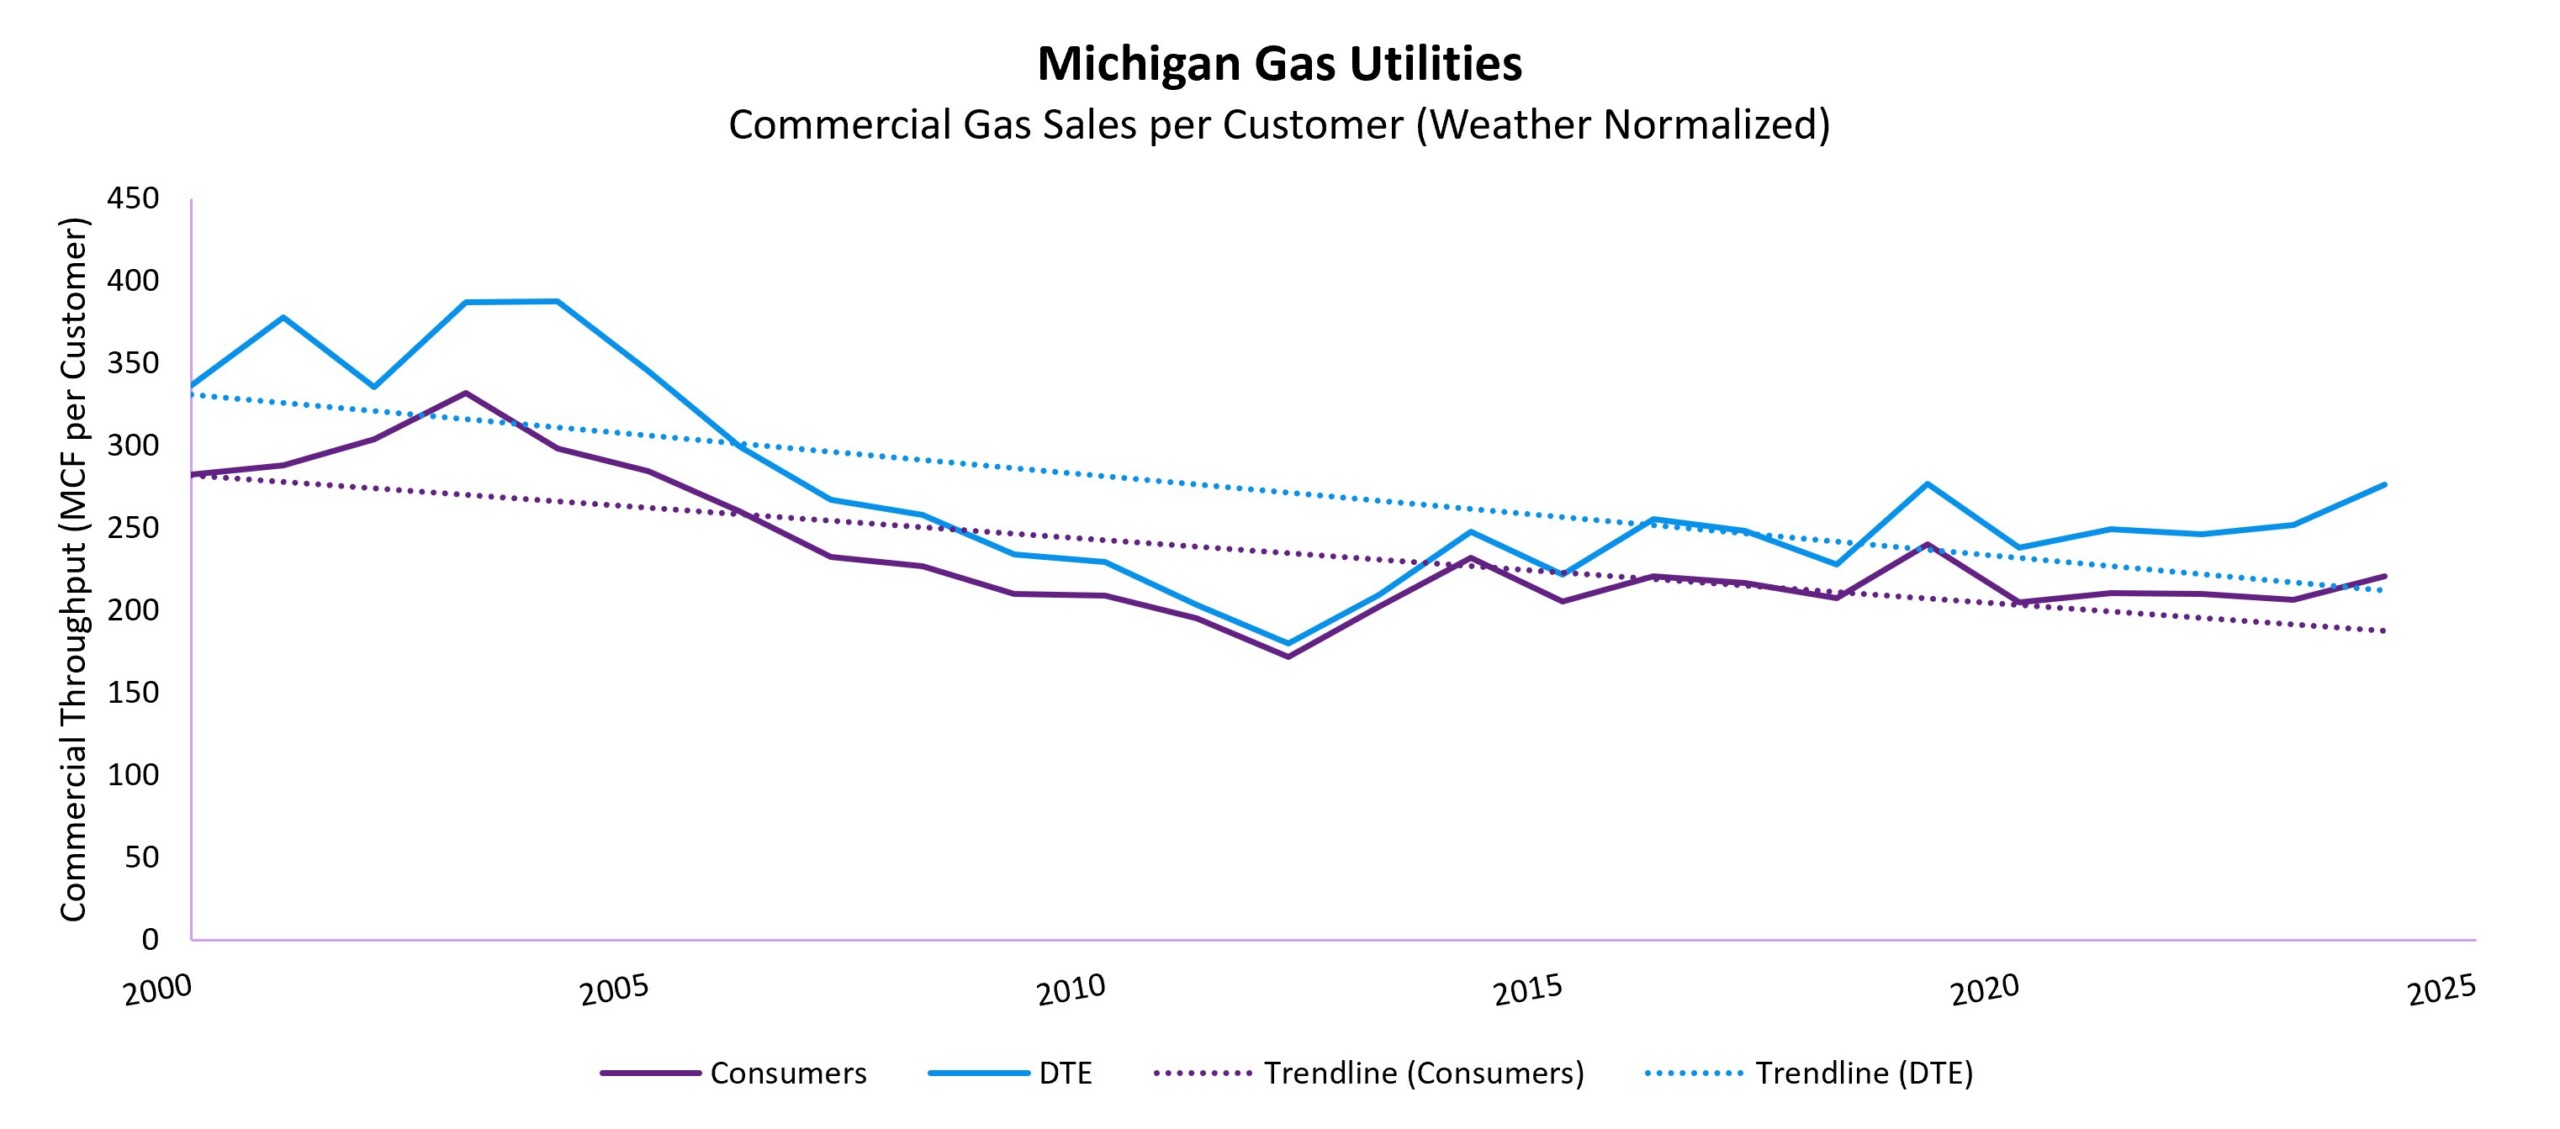
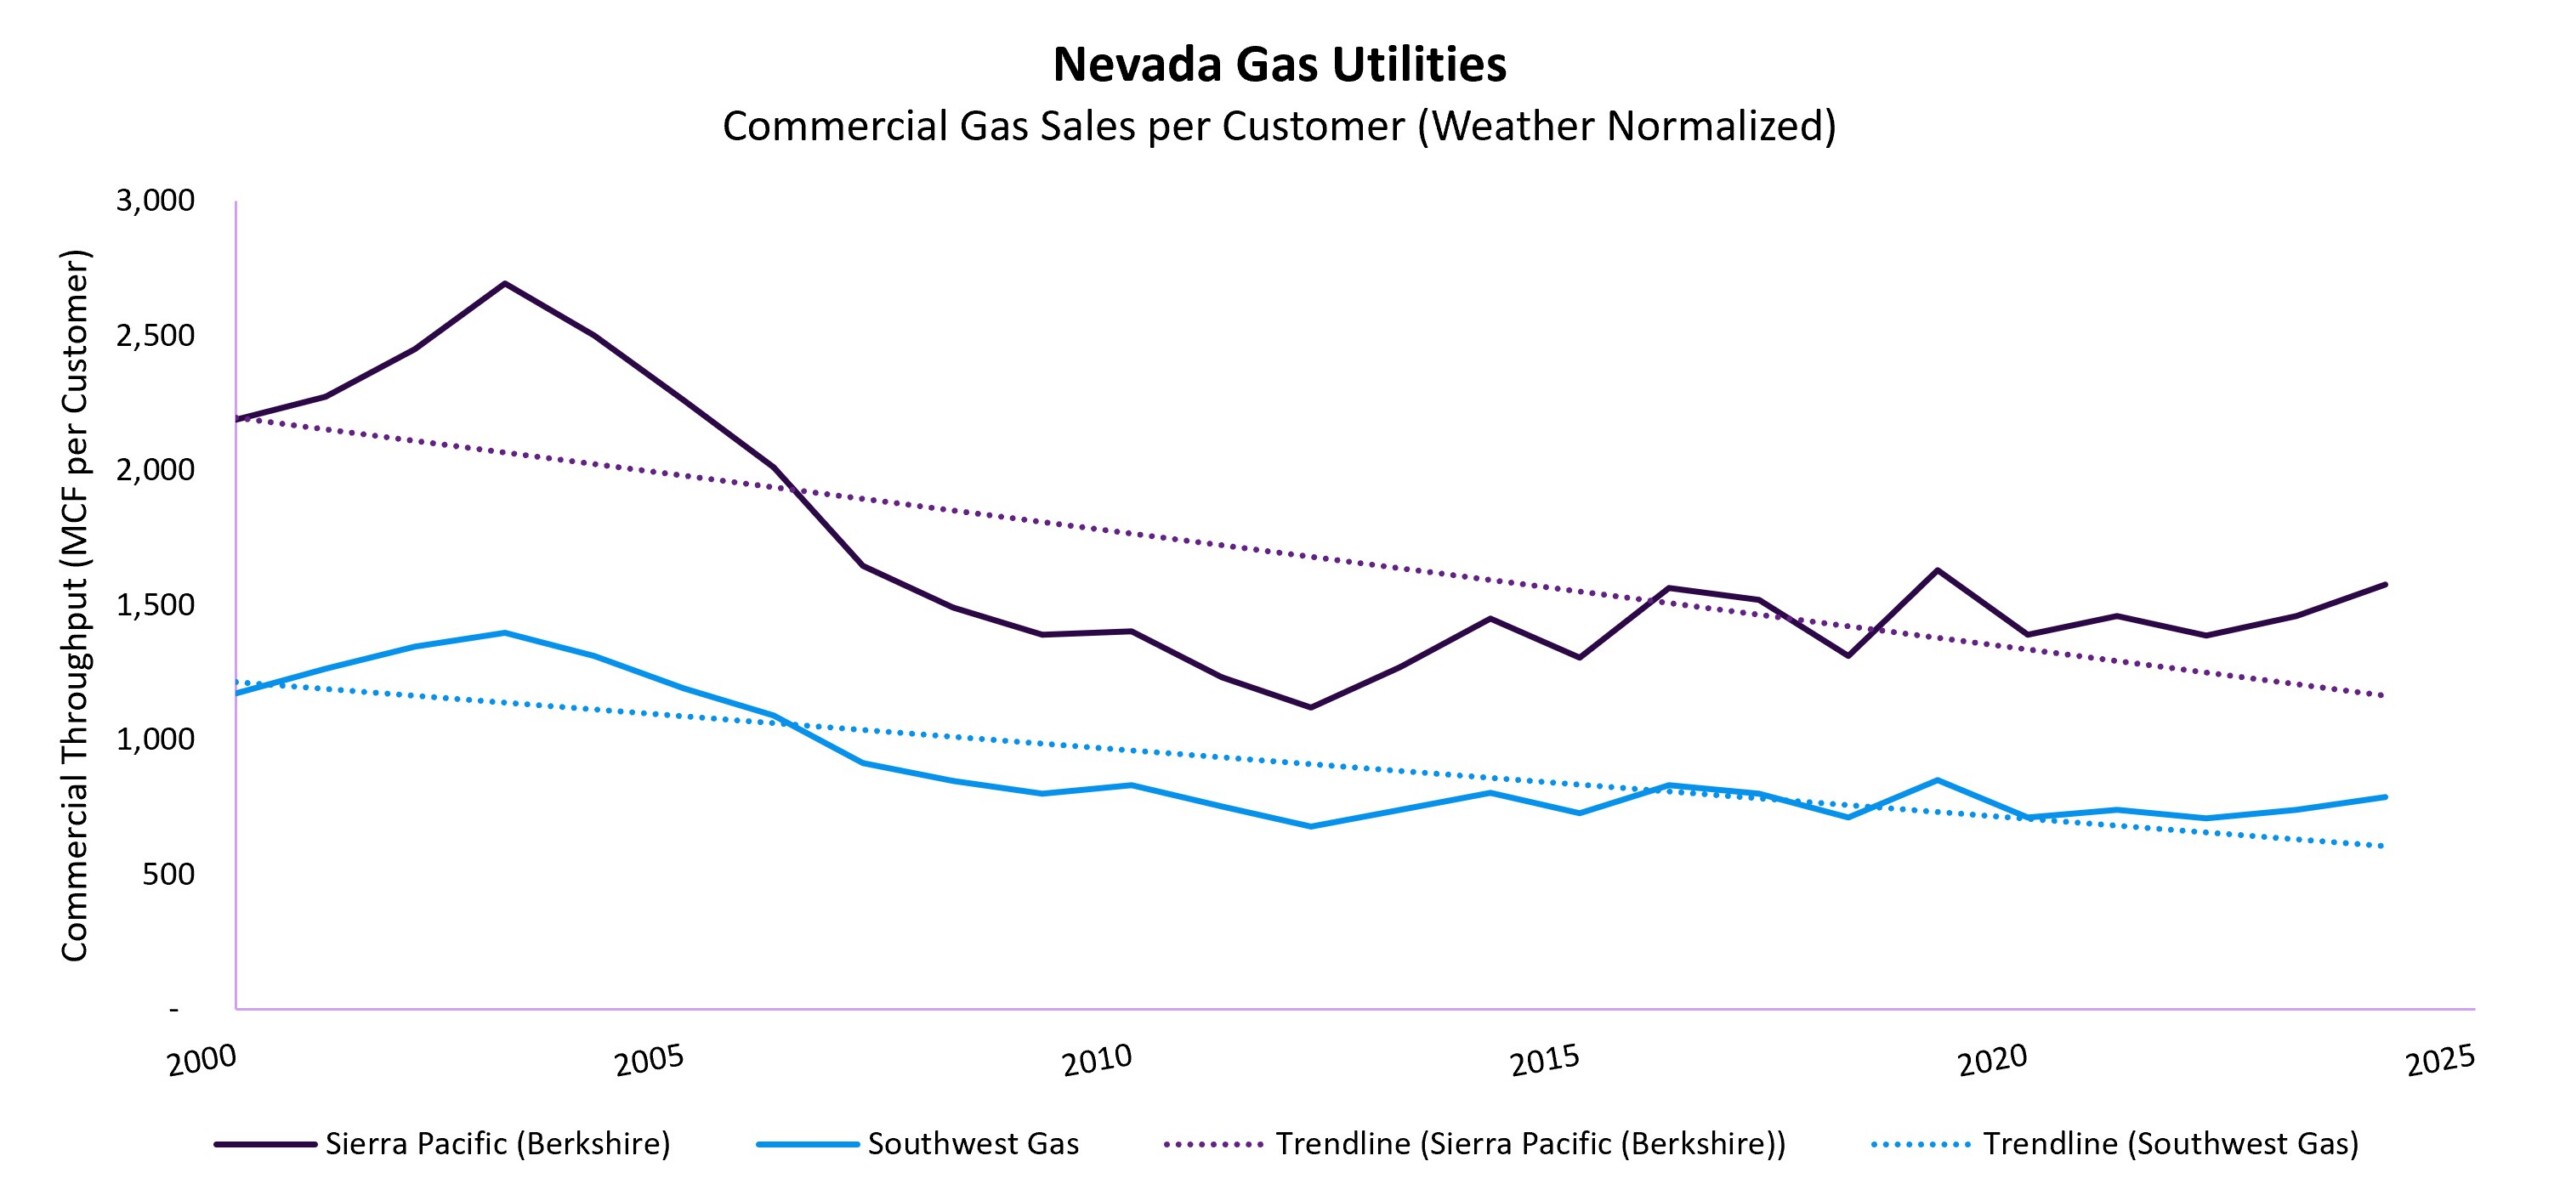
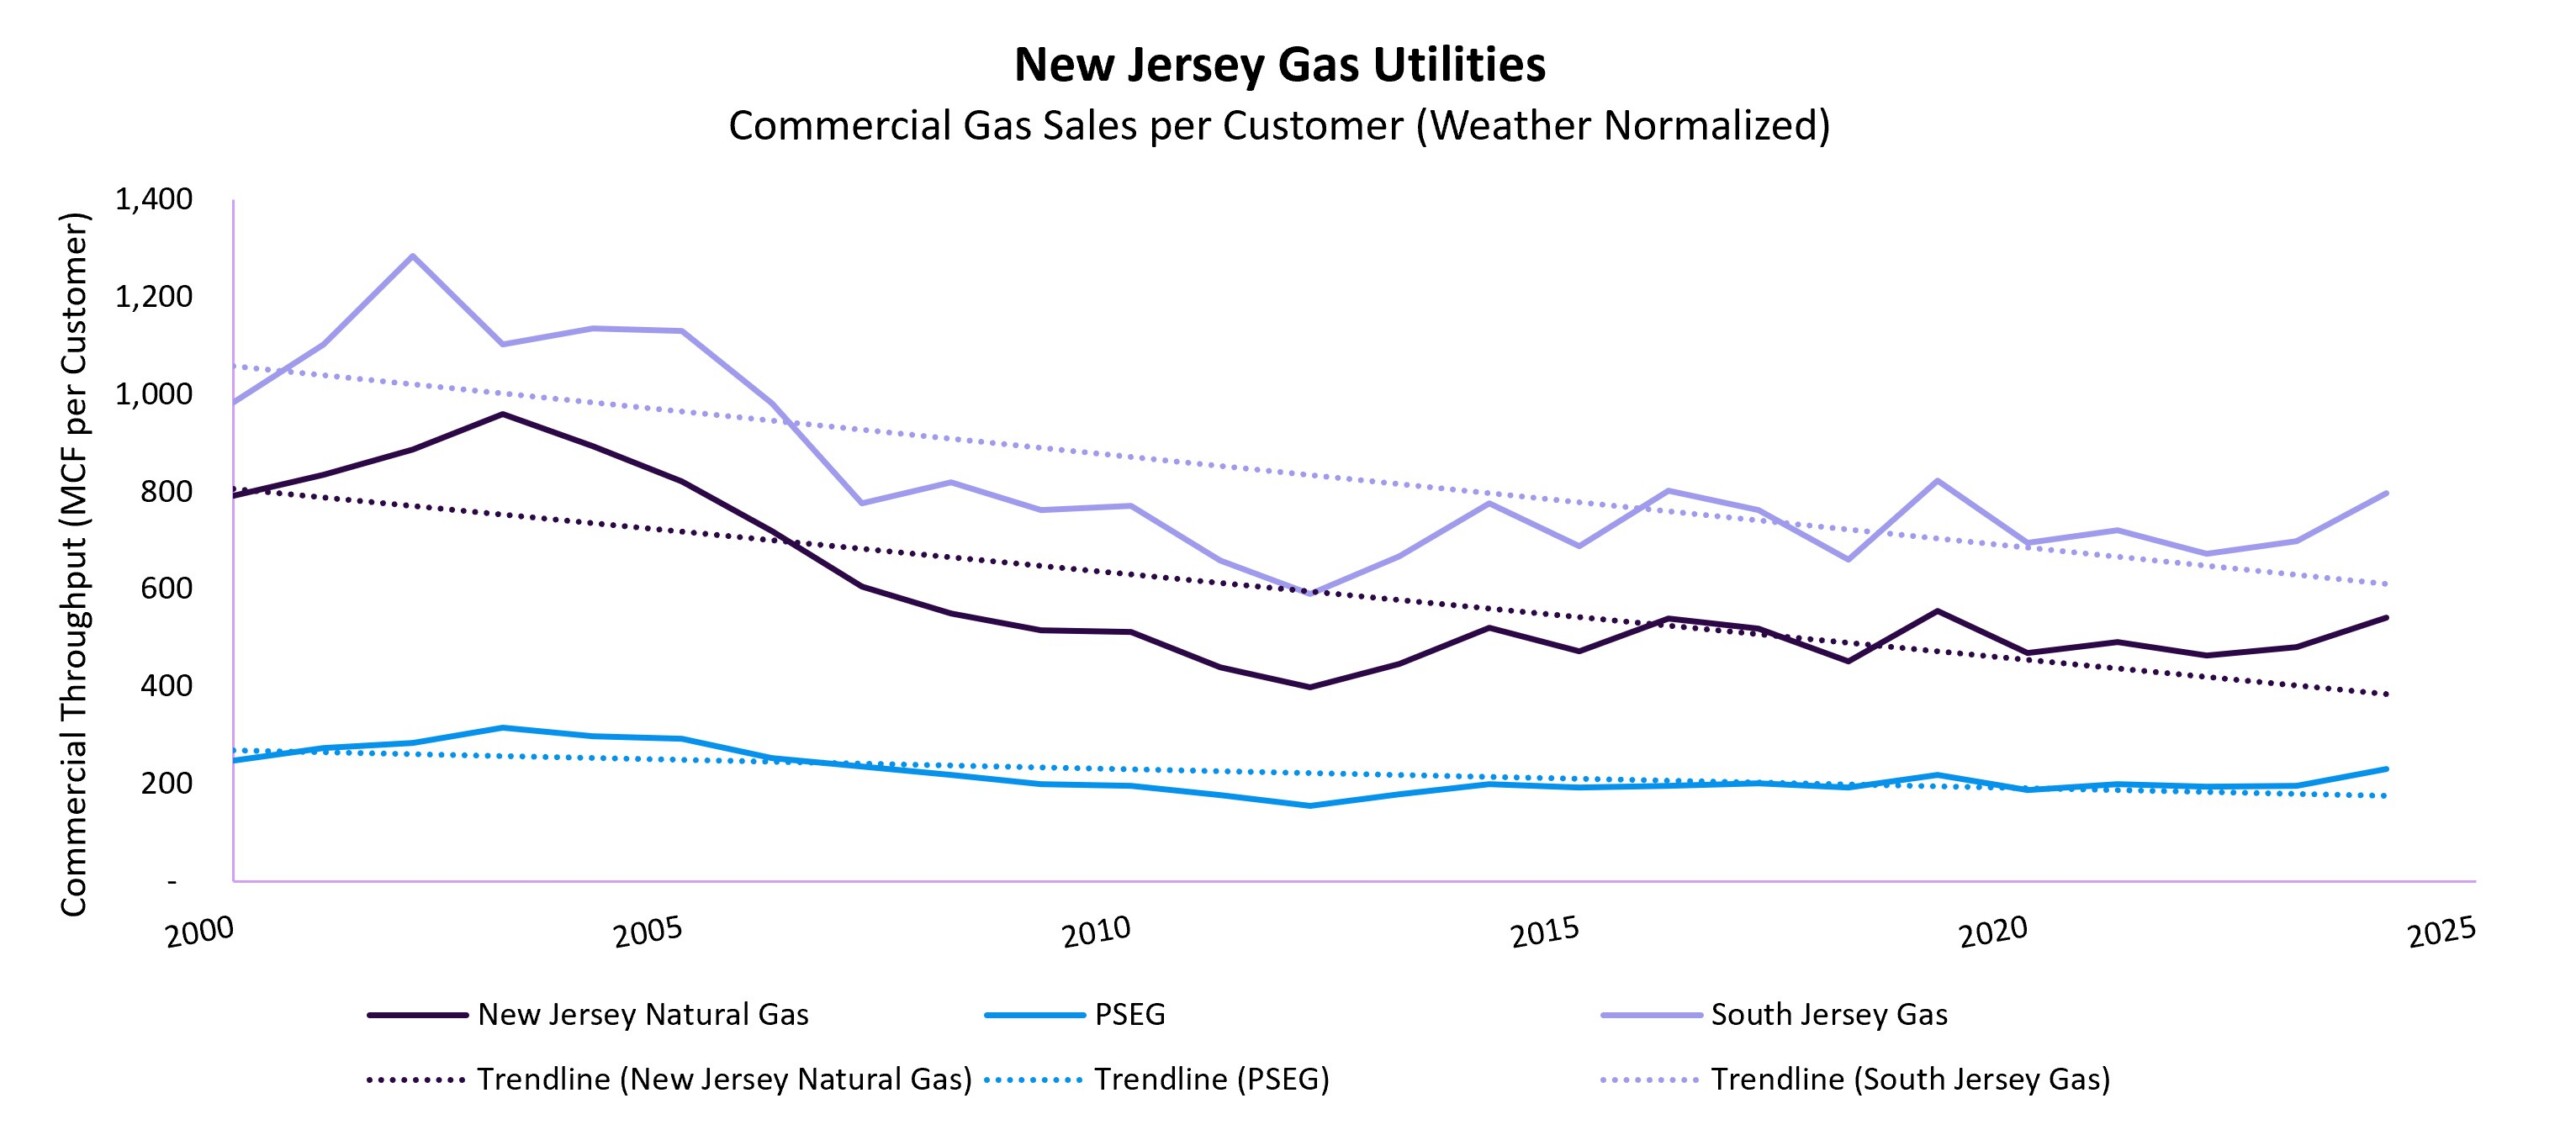
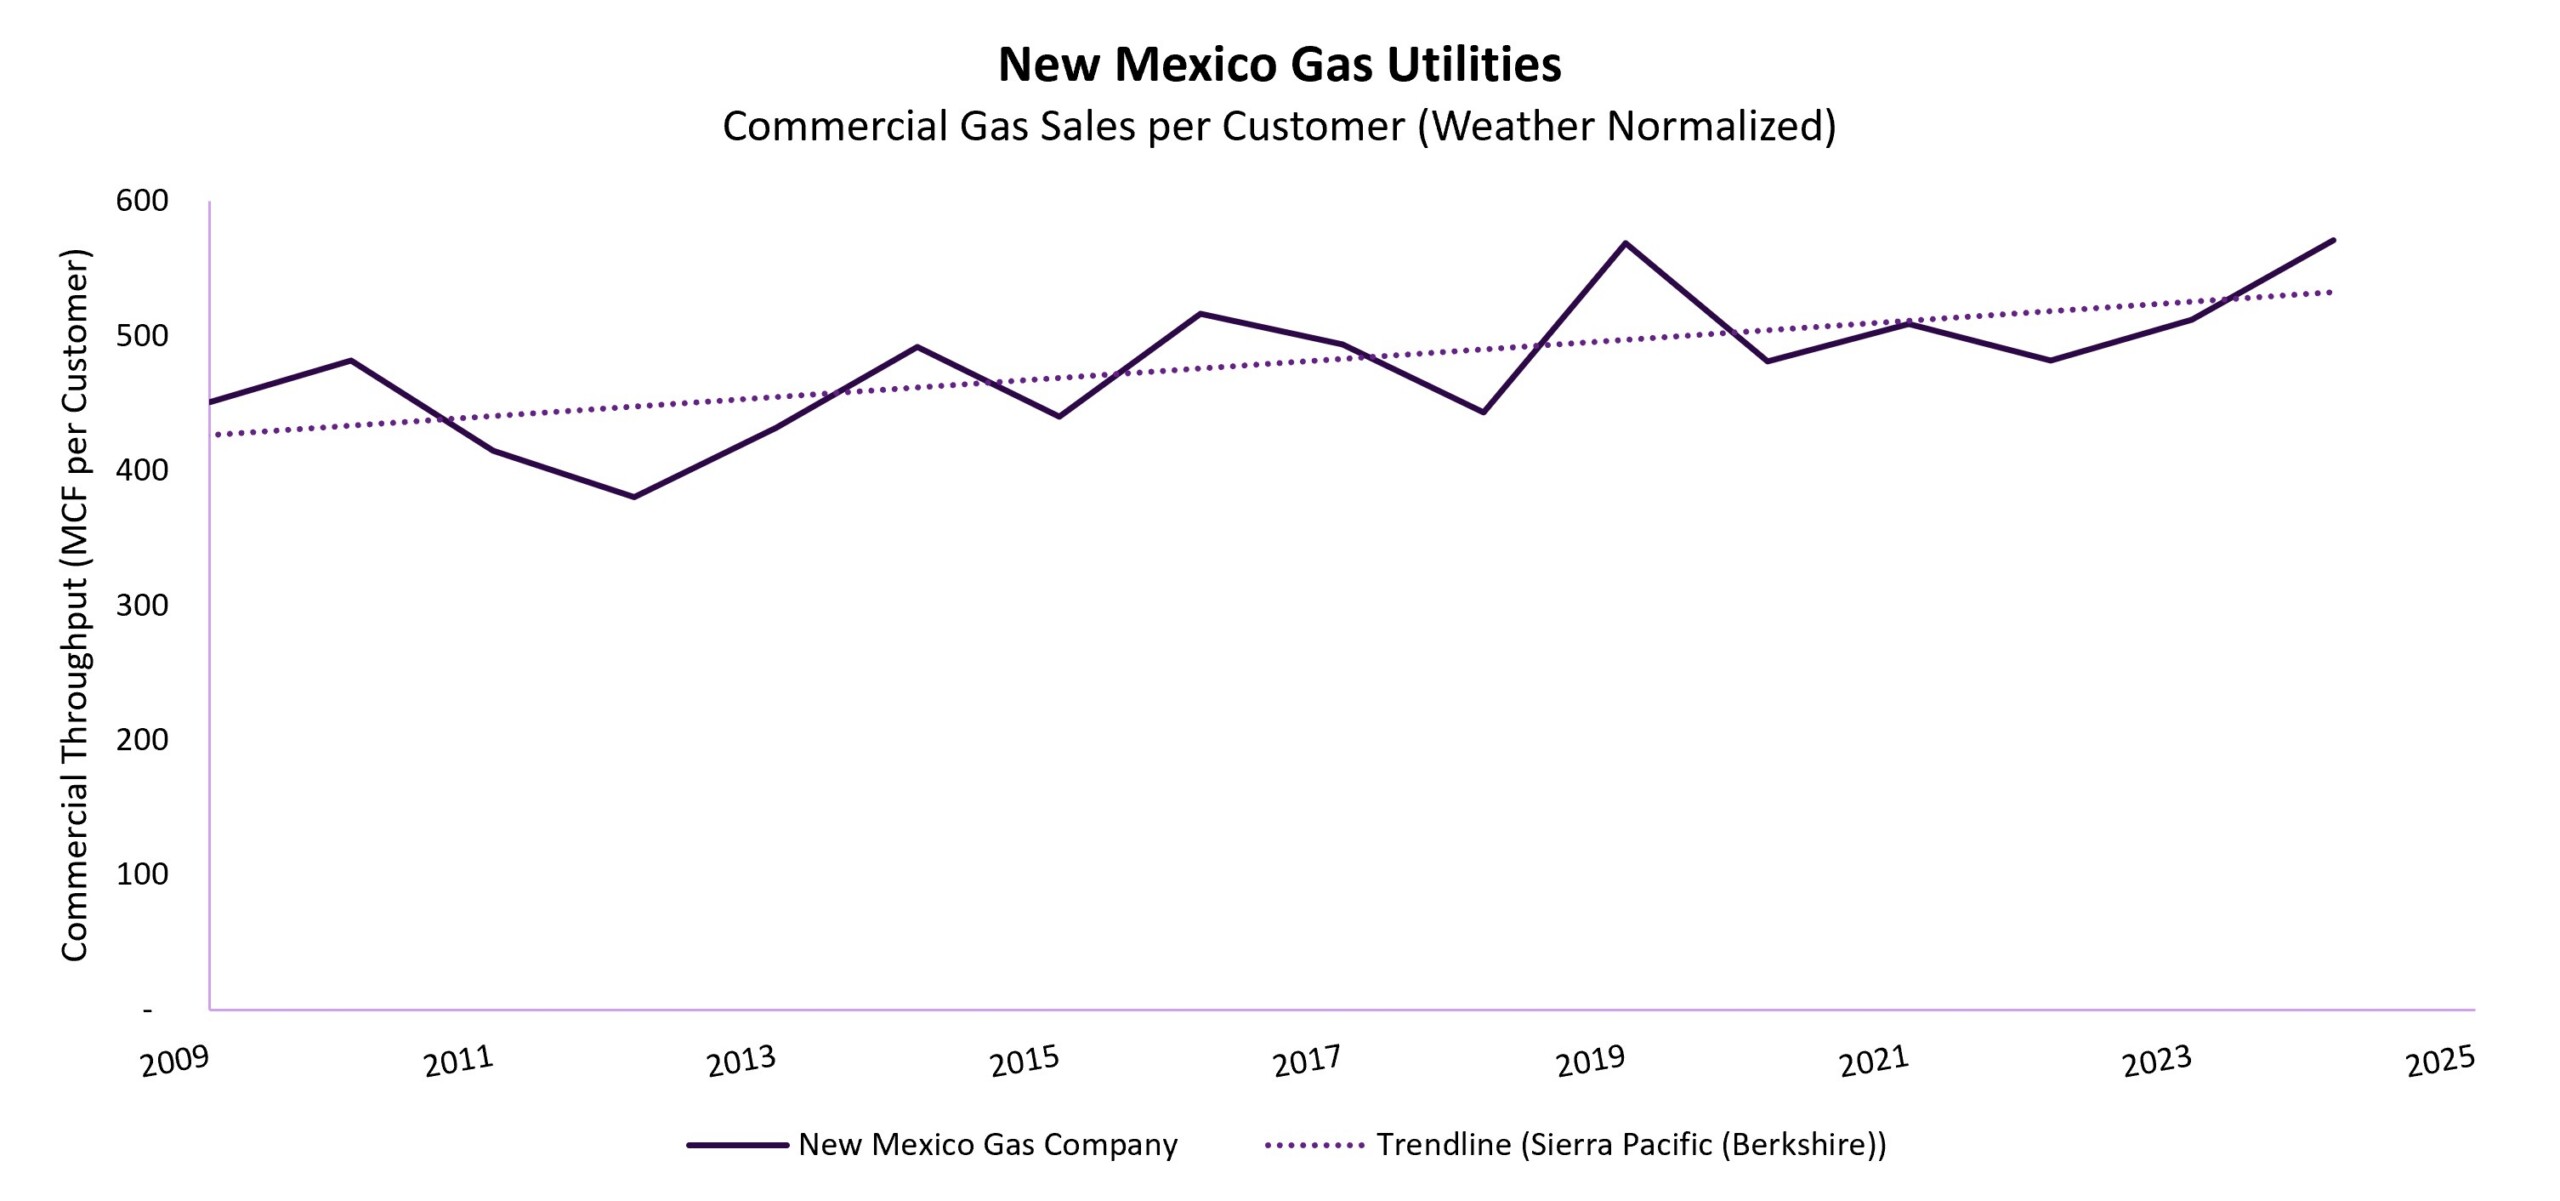
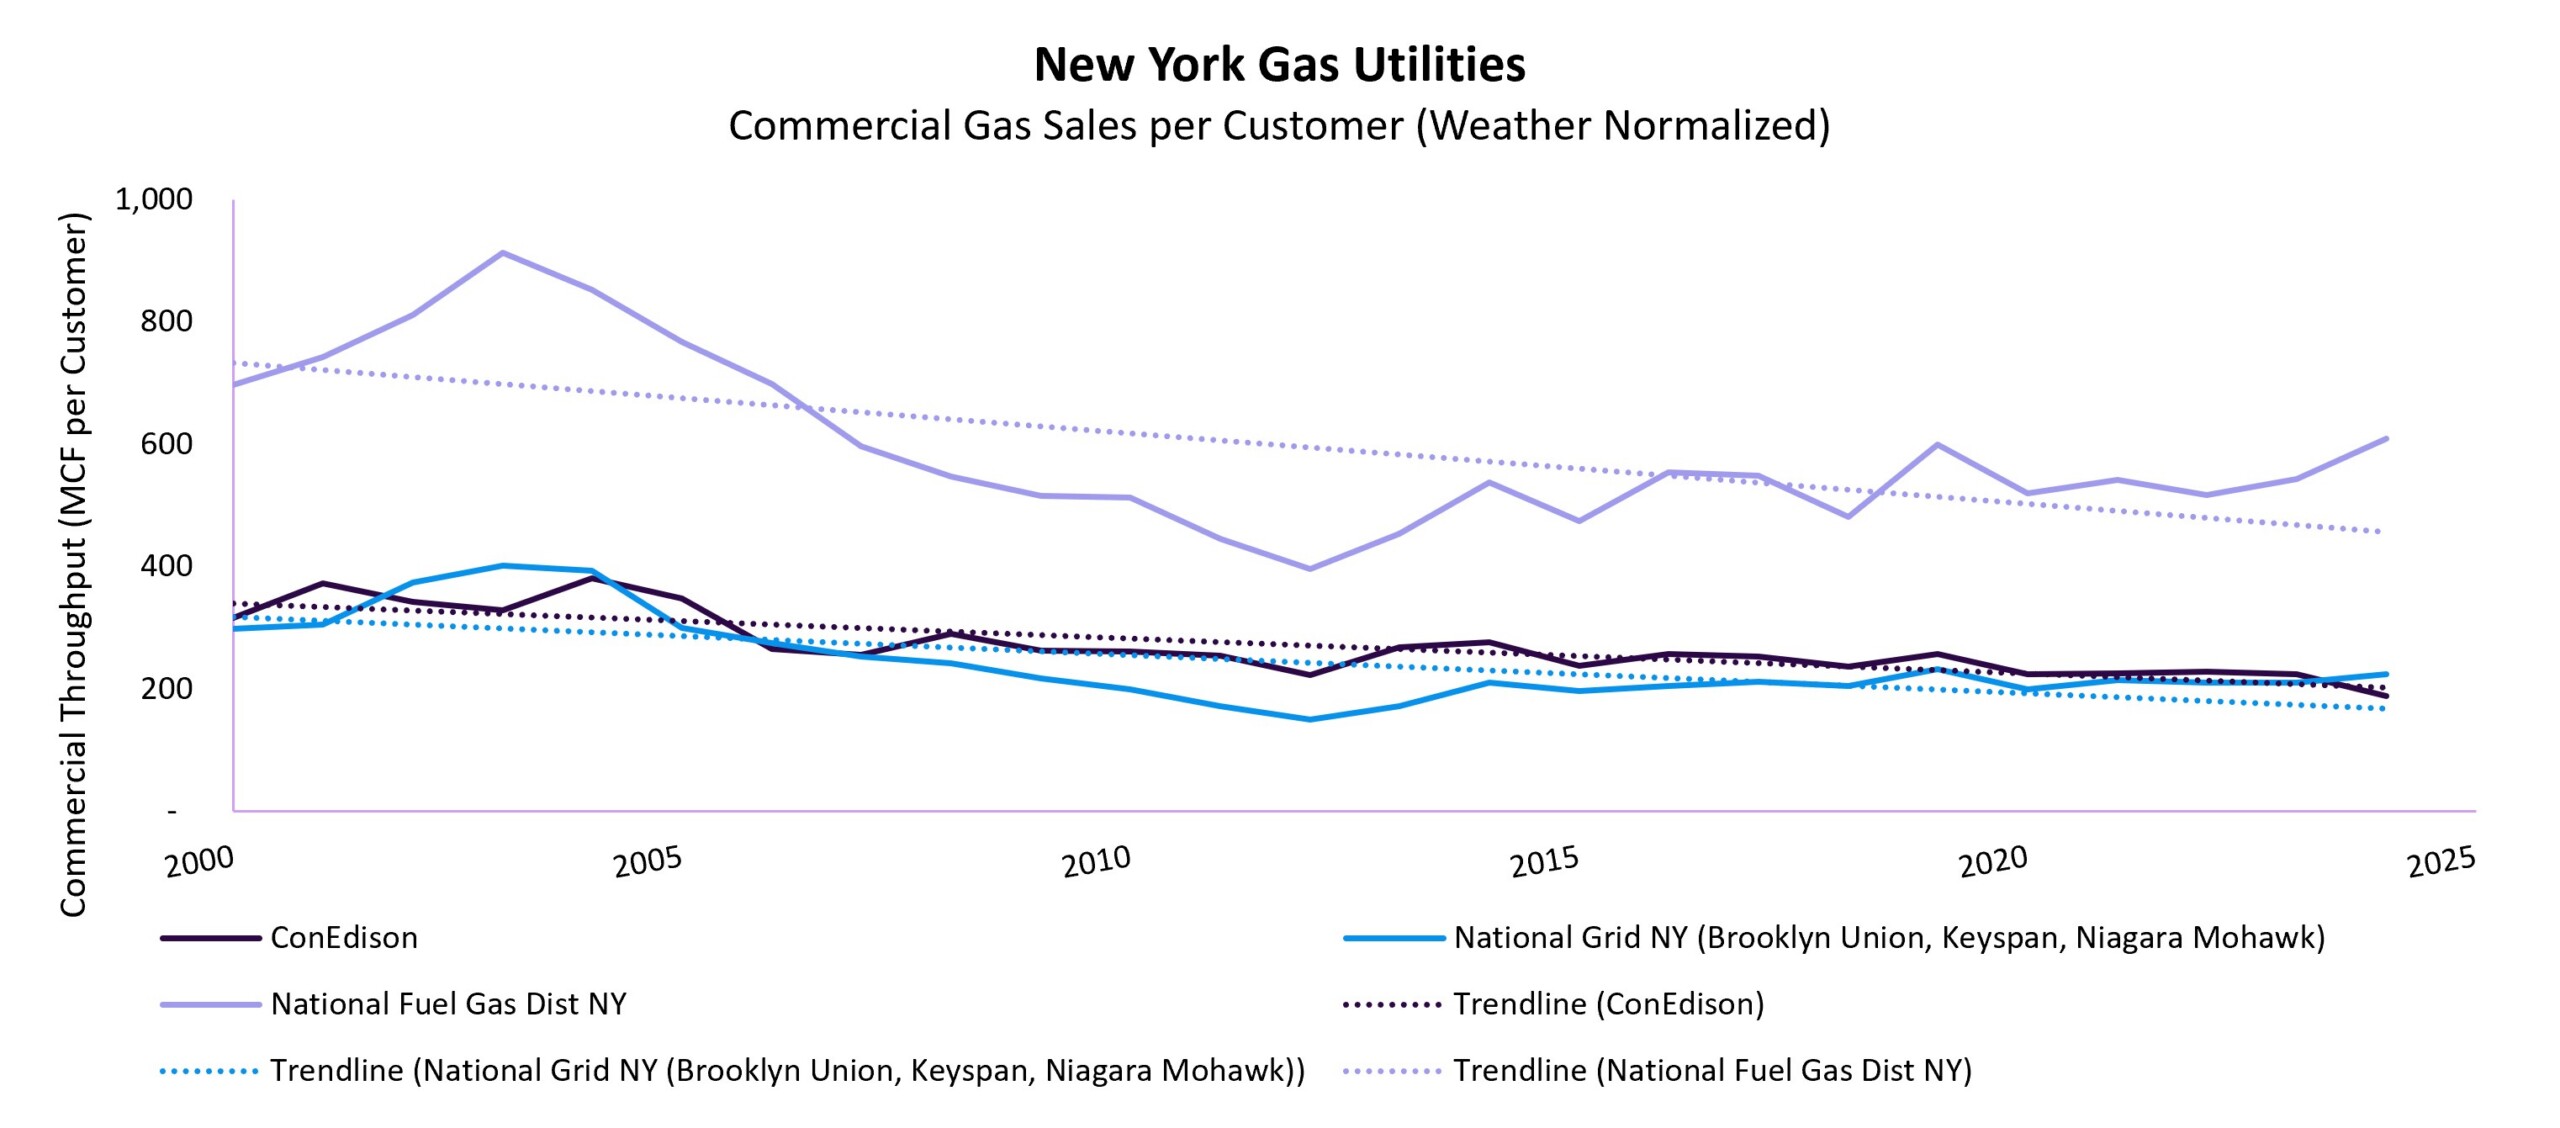
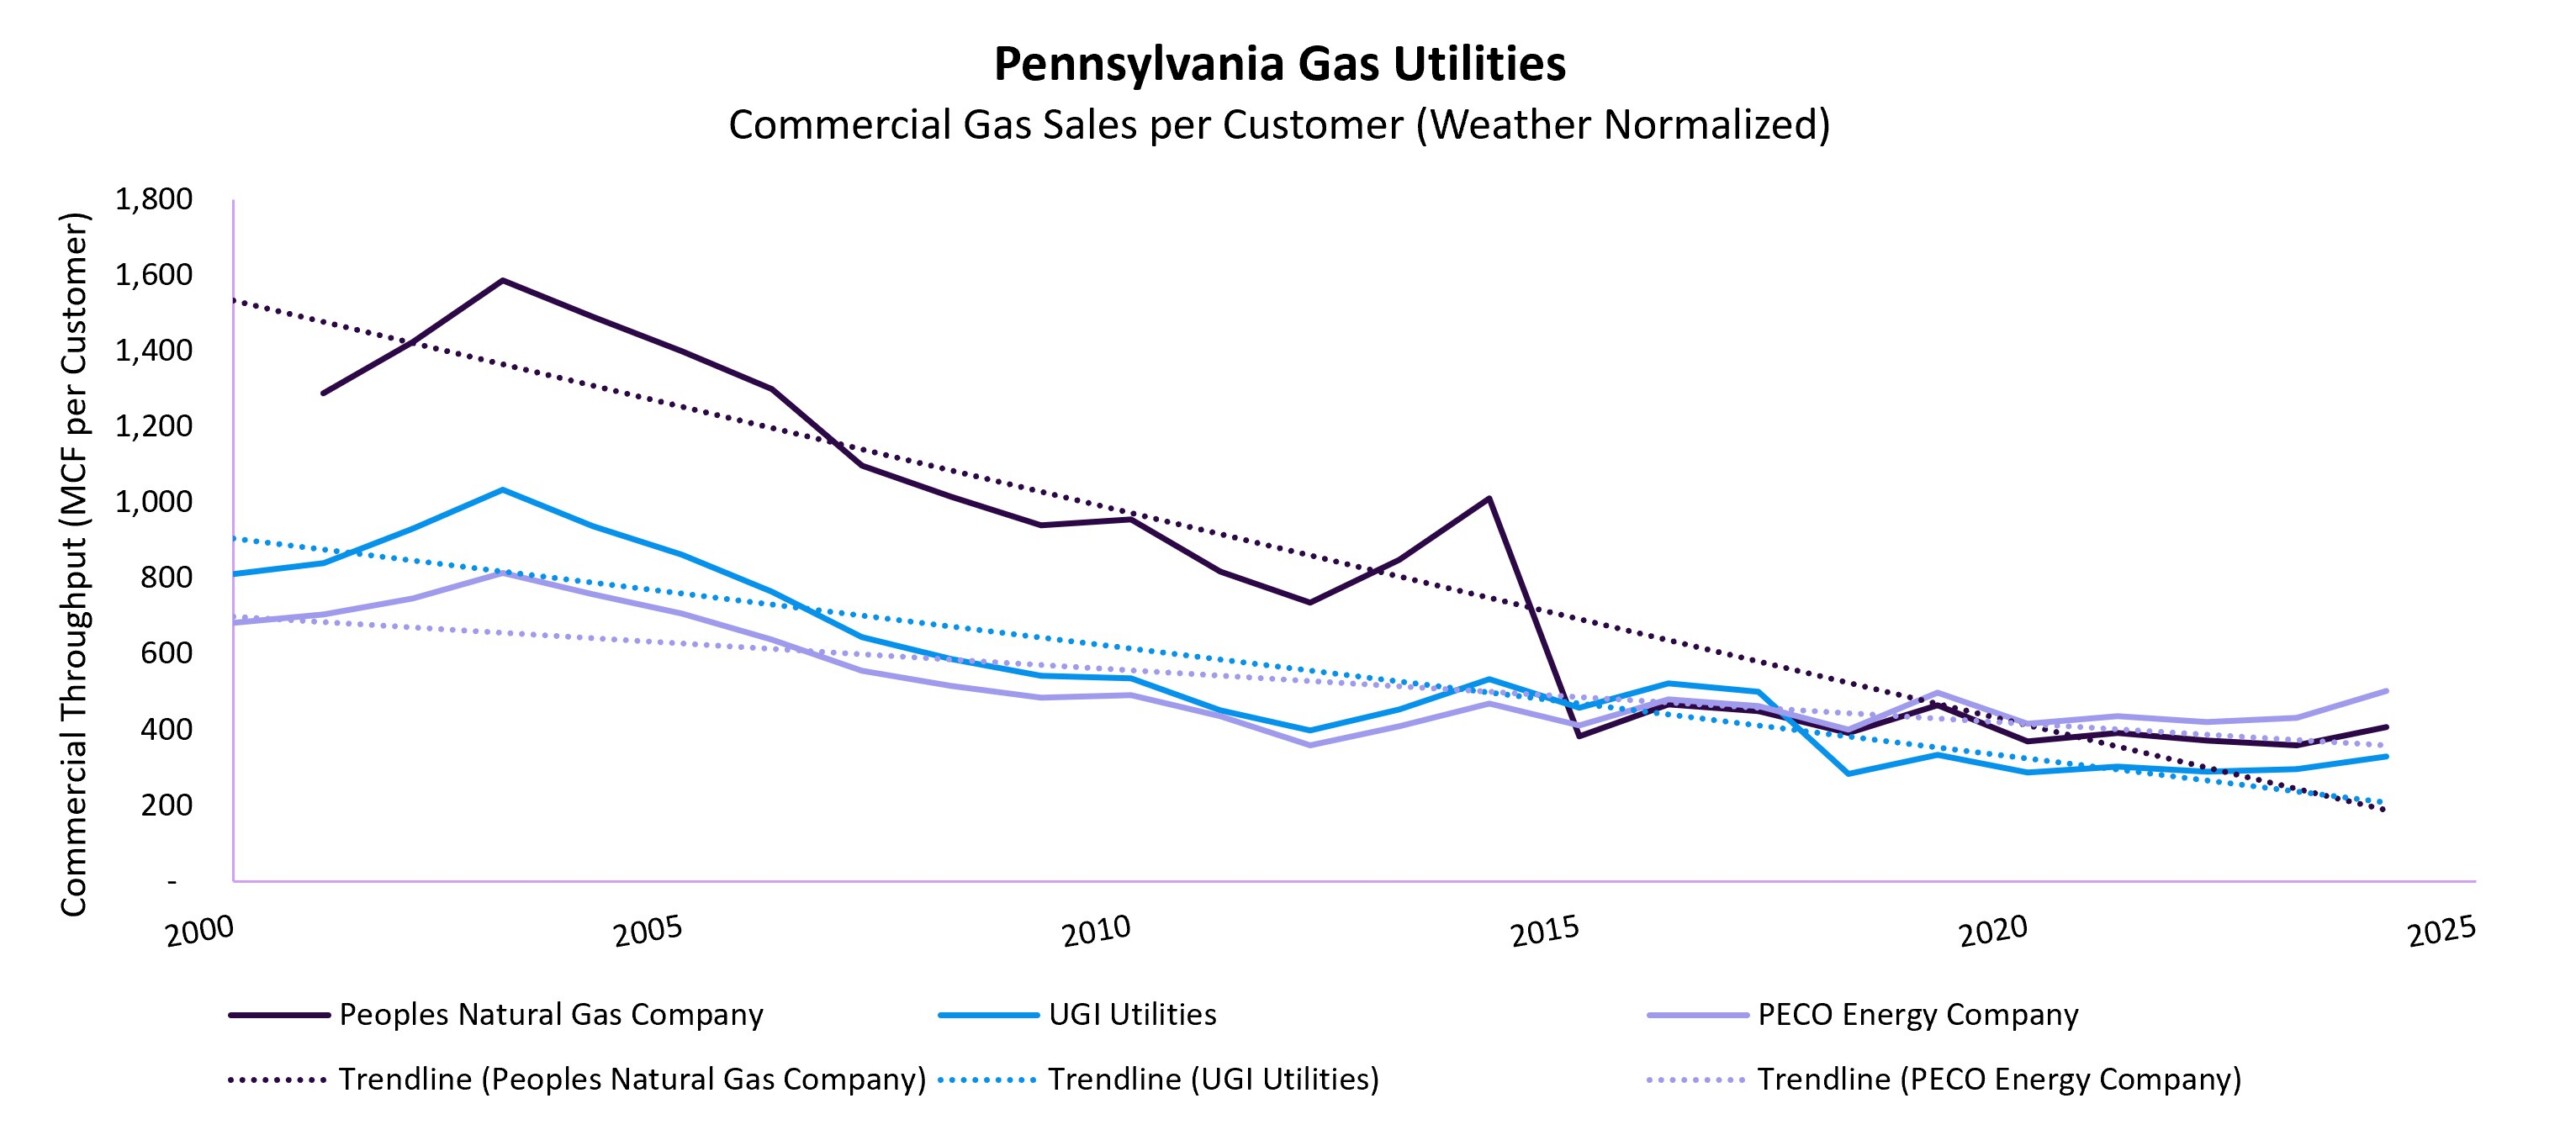
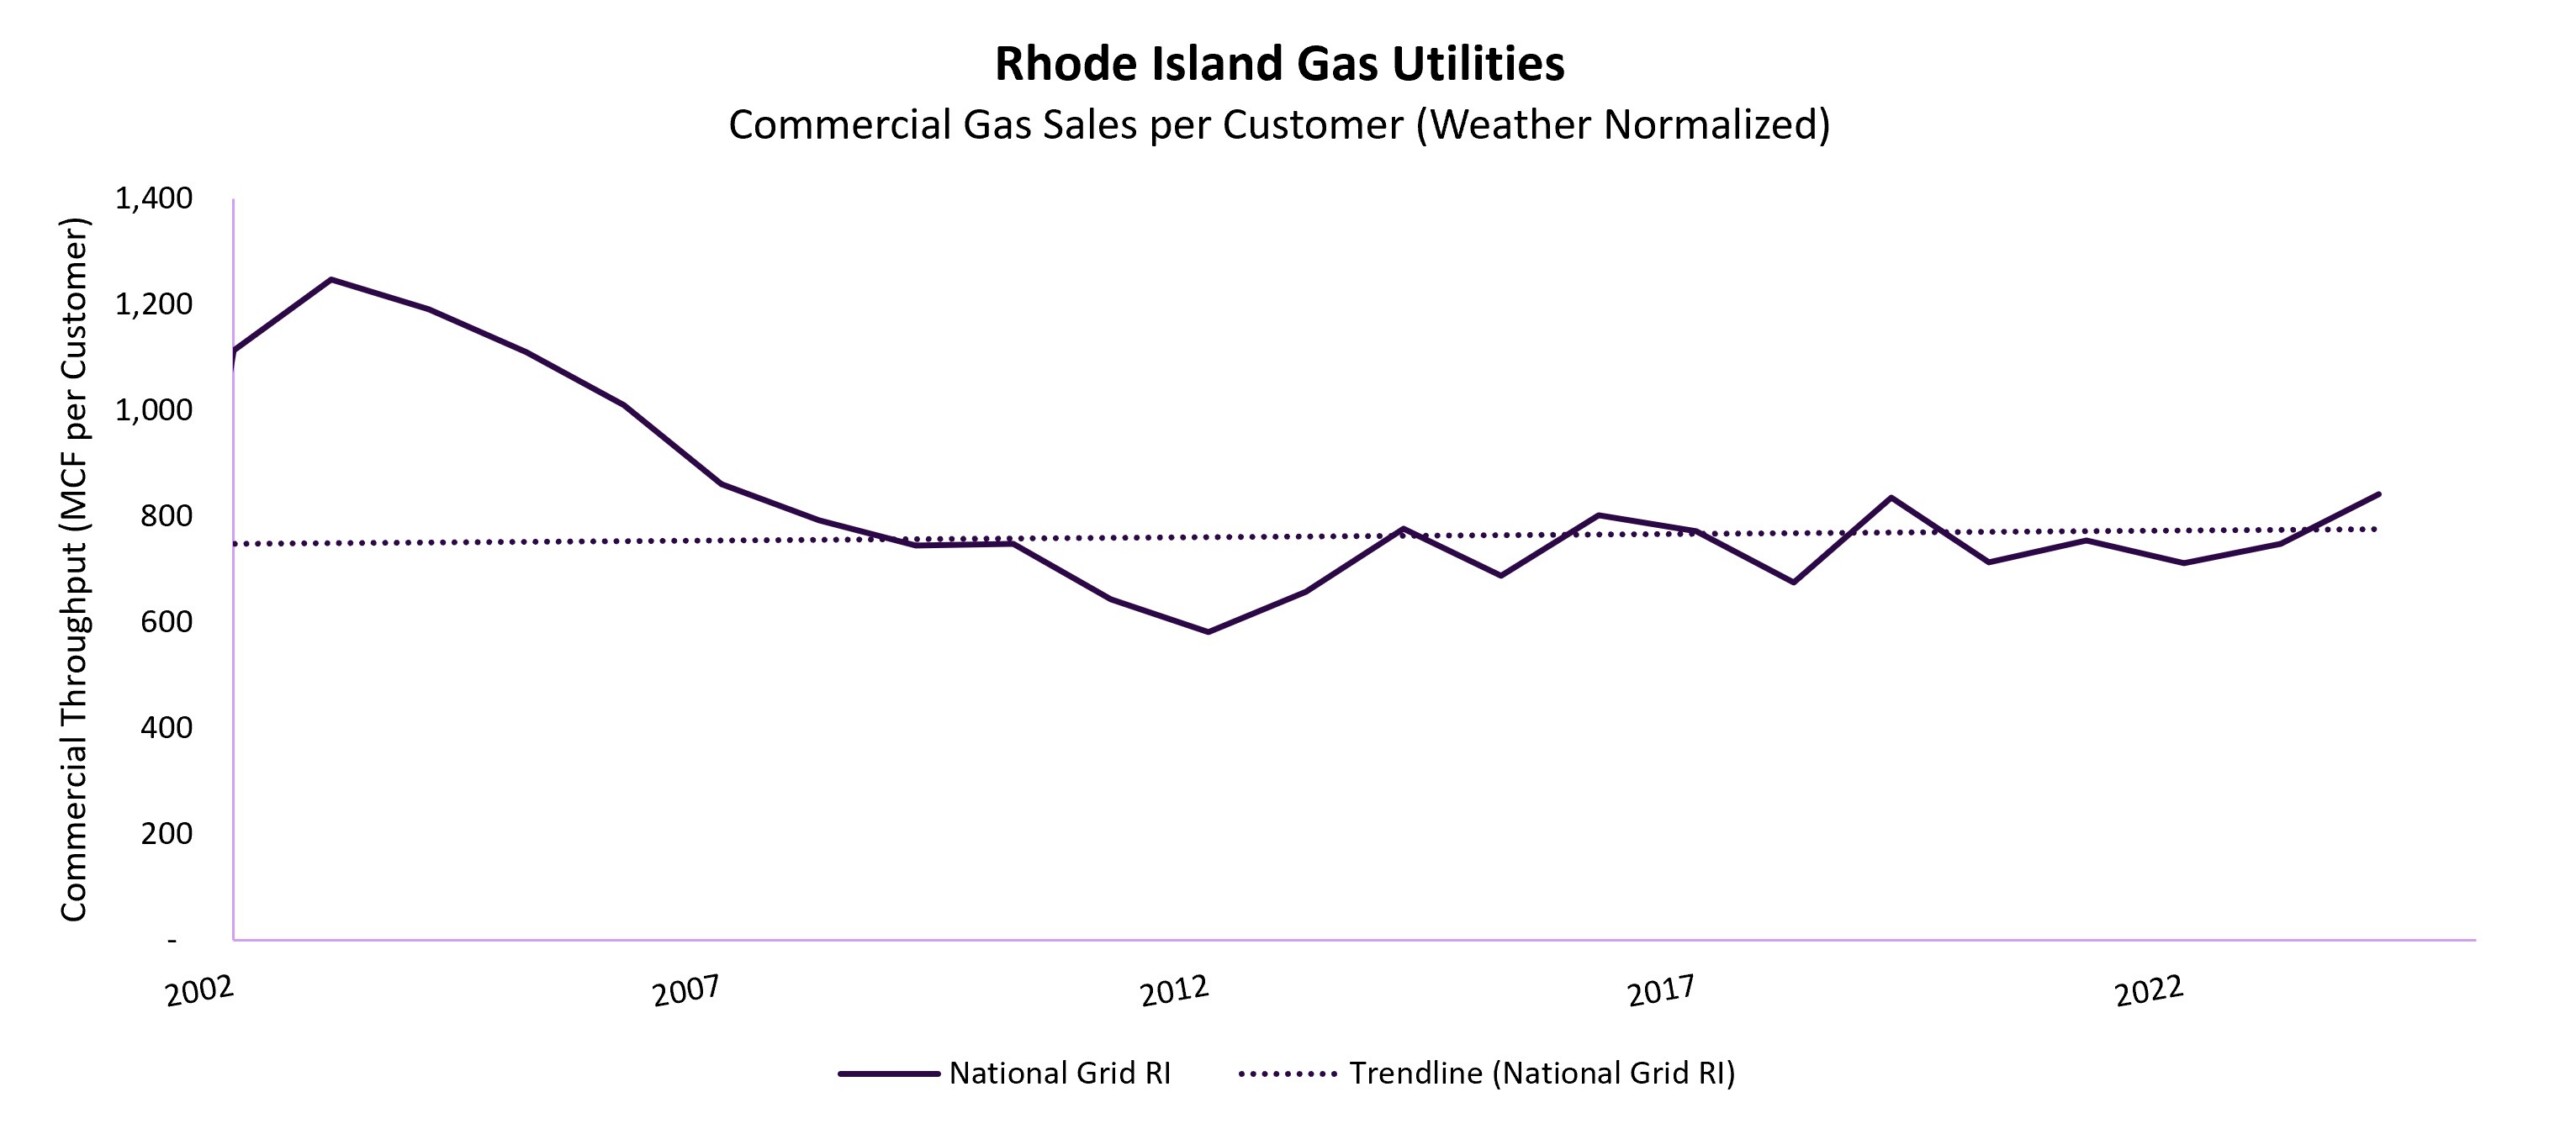
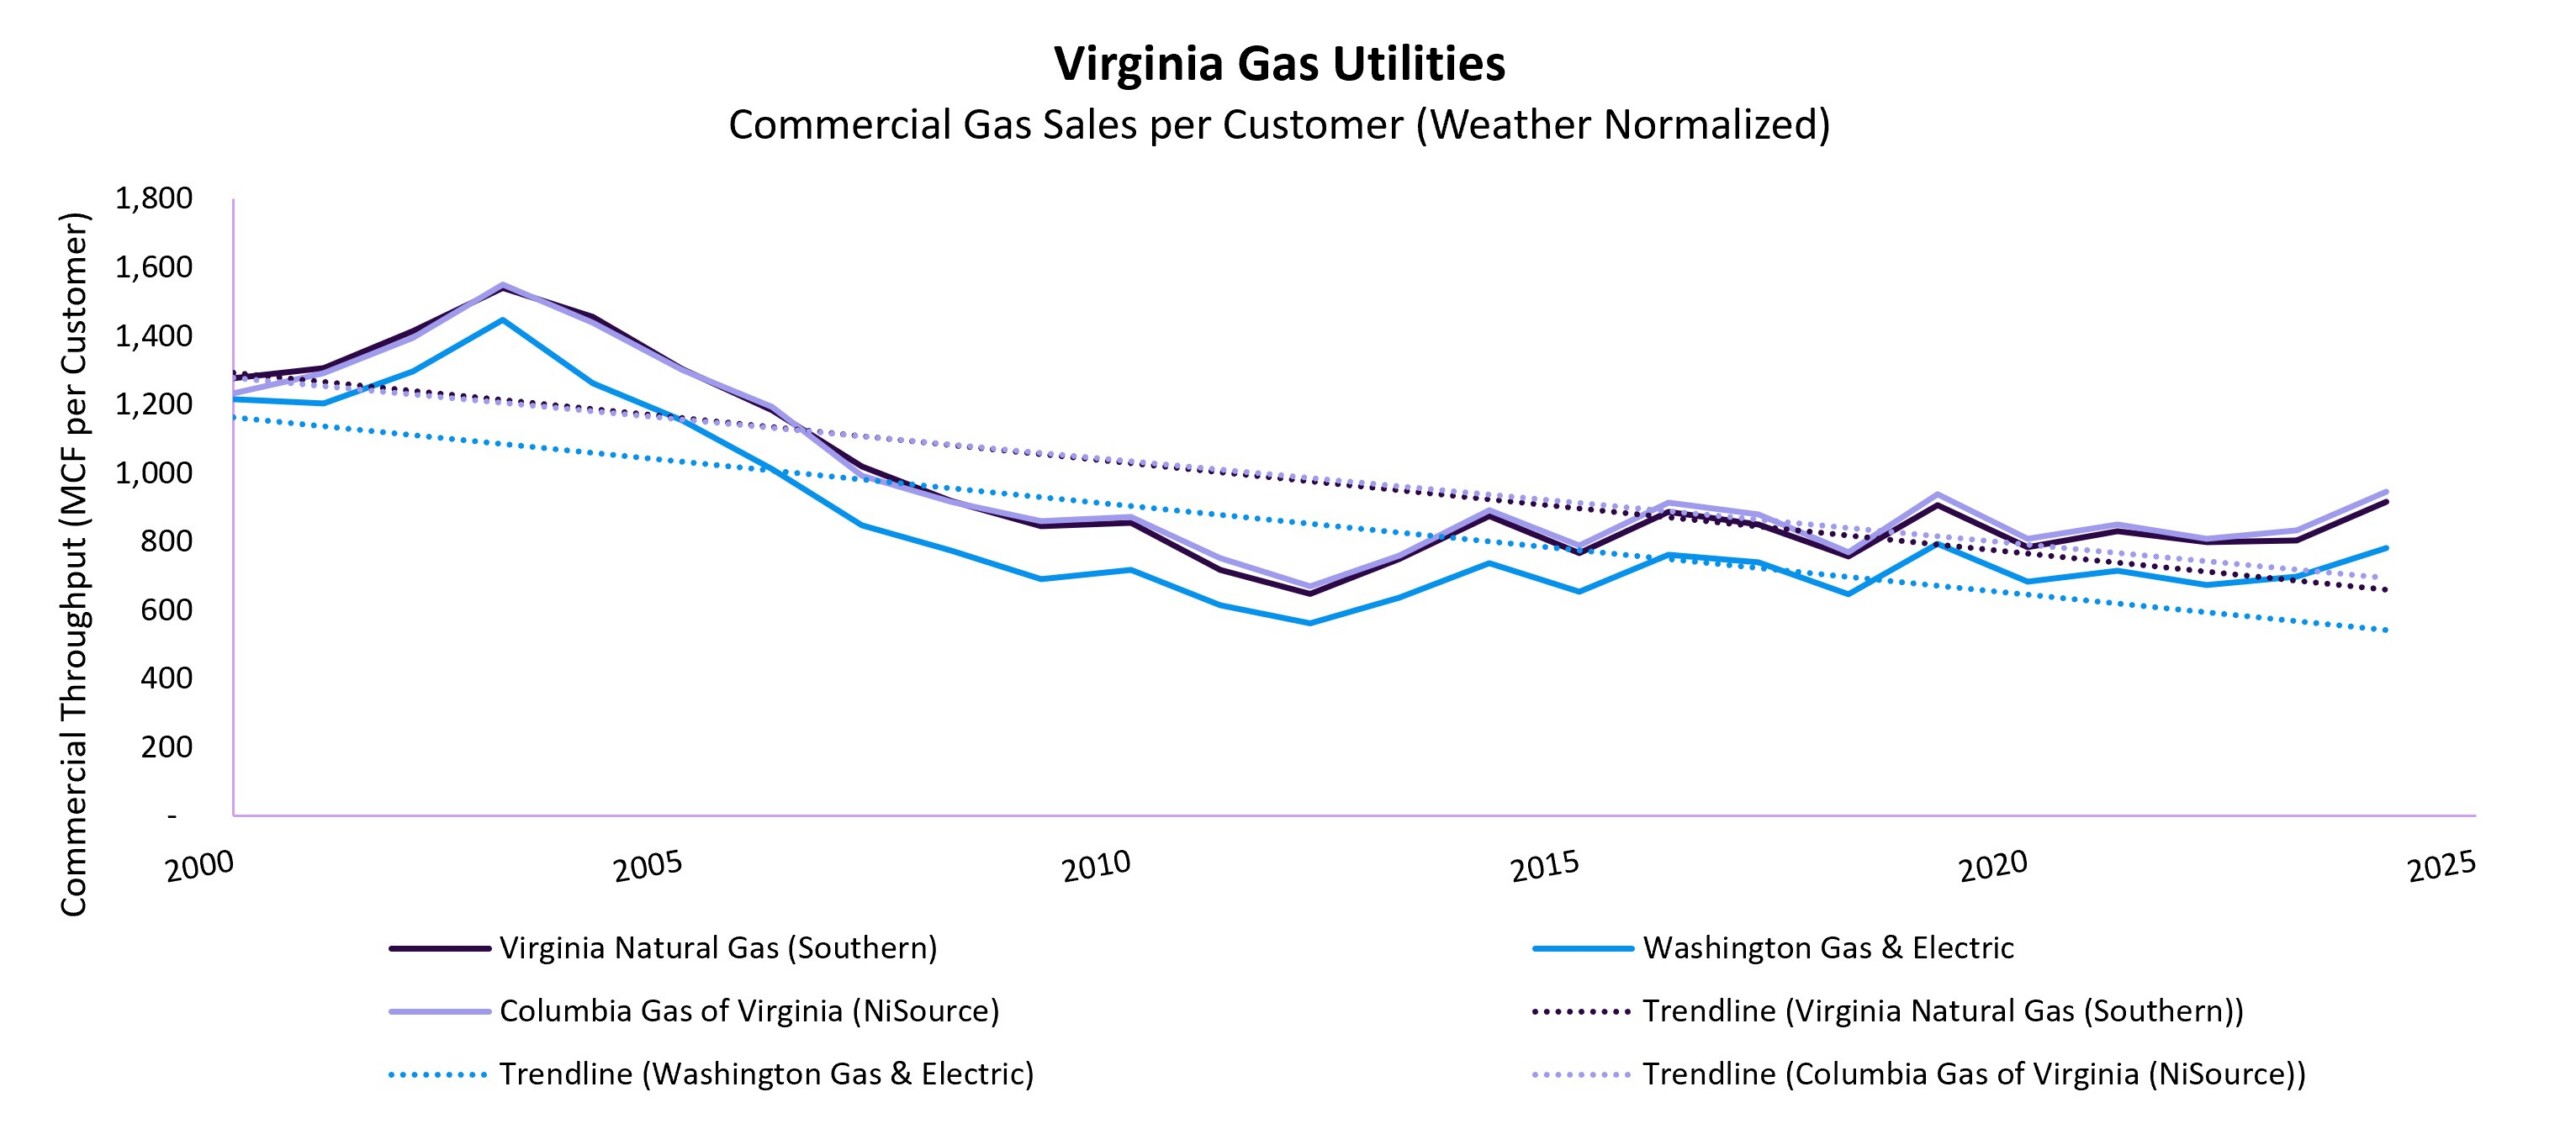
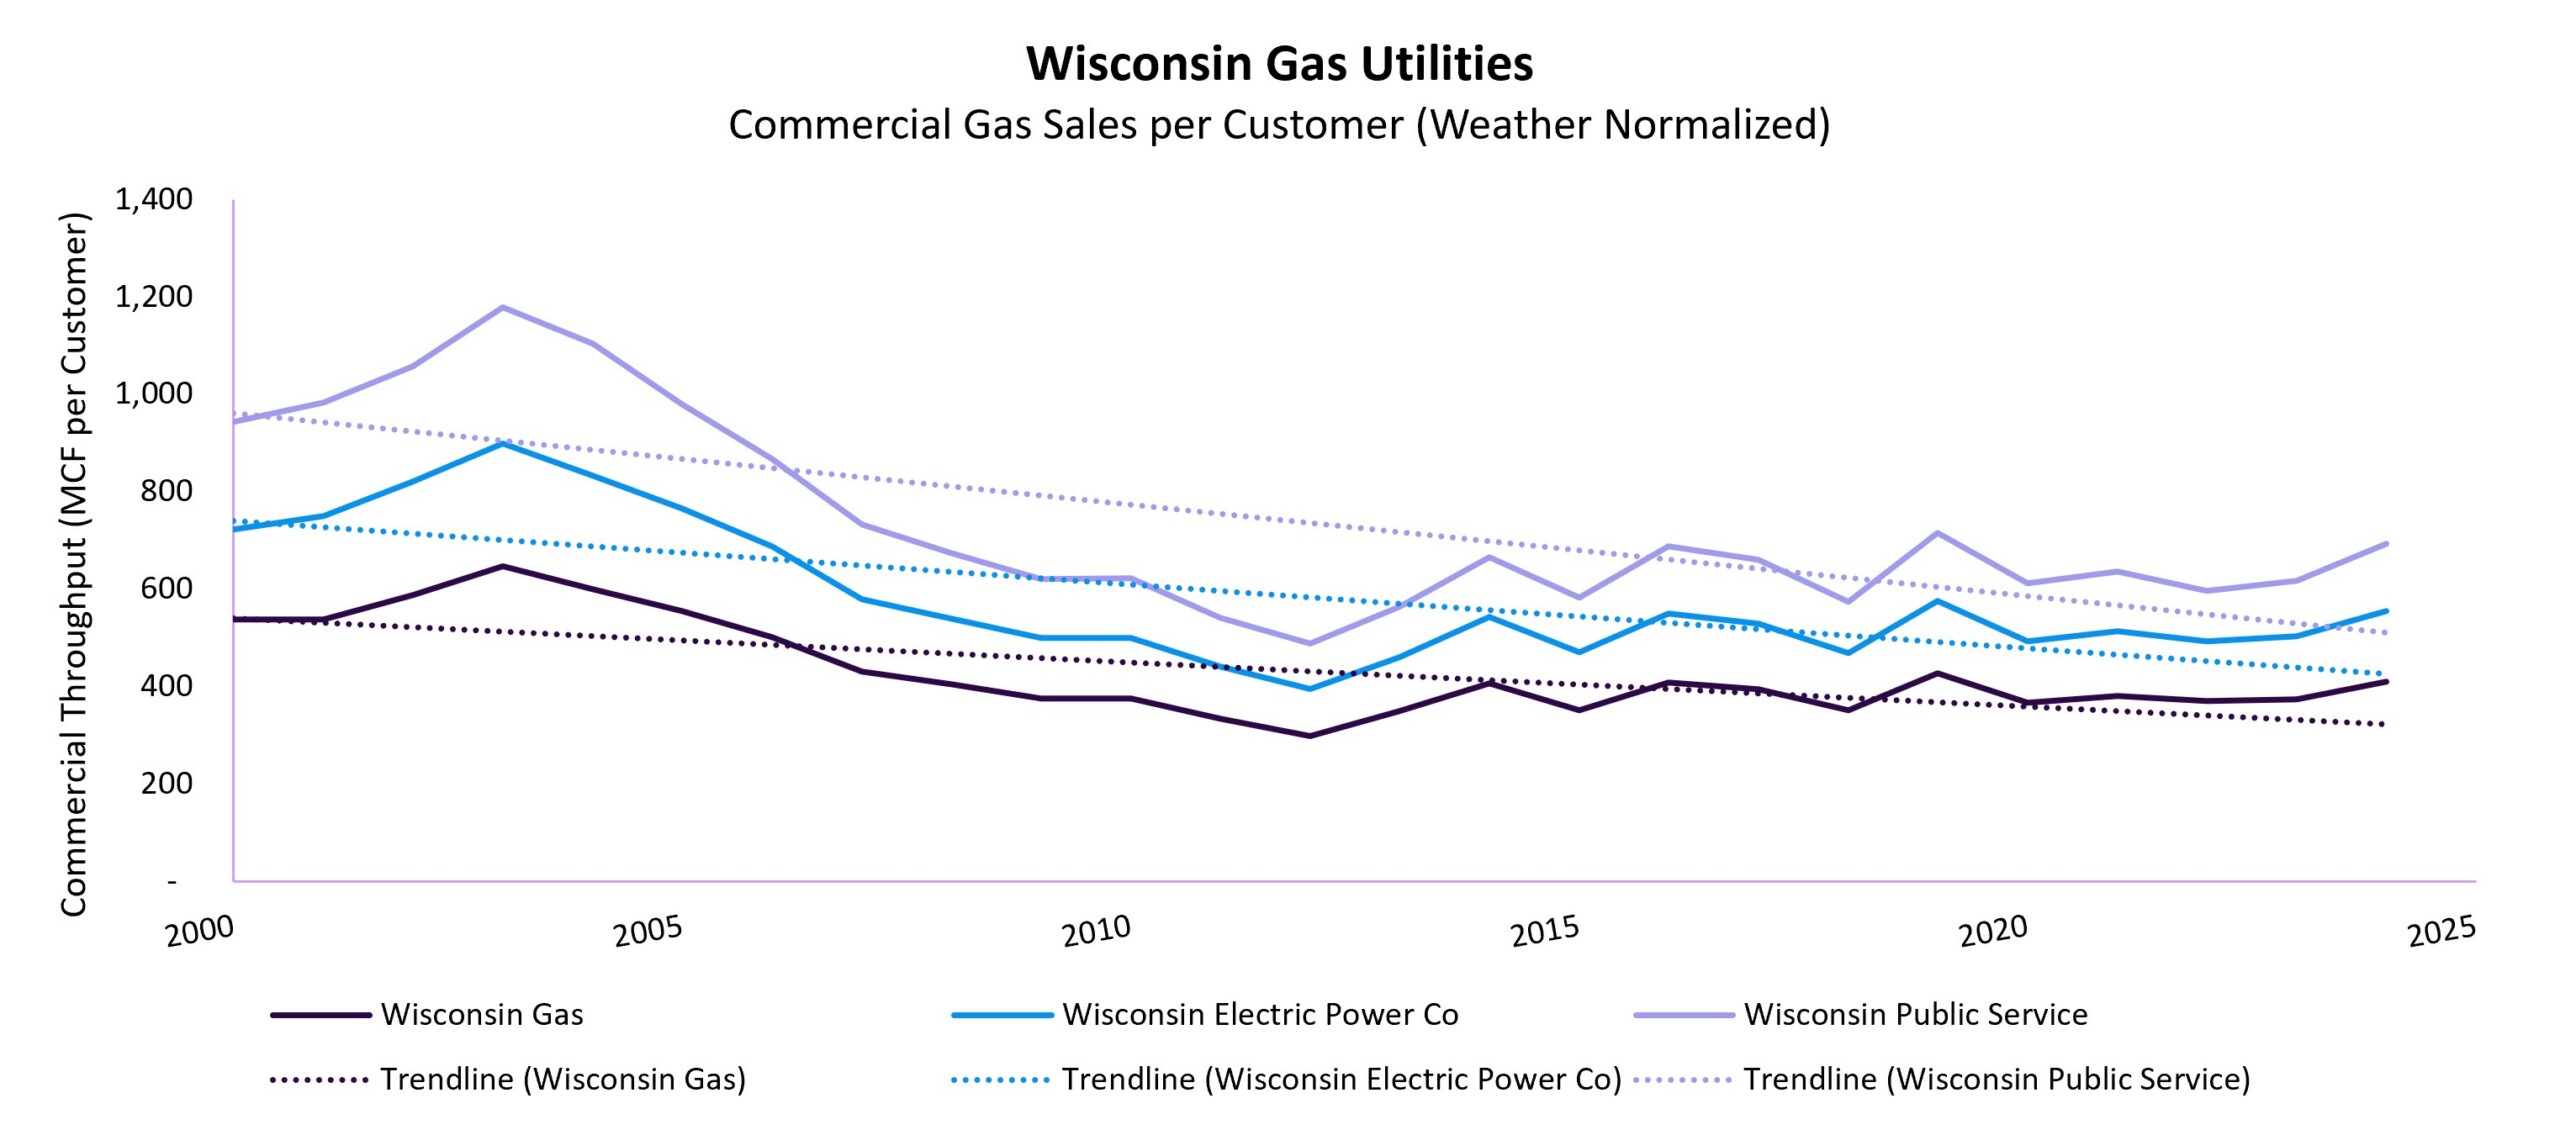
In most cases, commercial gas use per customer has decreased slightly or remained relatively flat. We assume this reflects efficiency gains due to improvements in gas appliances, updated building codes for new construction and major renovations, and two decades of building shell improvement work.
Exceptions include New Mexico Gas Company and Colorado’s Black Hills (though Black Hills’ data follows such an unusual pattern that we cannot easily attribute it to the energy efficiency and weatherization efforts that we believe largely explain other commercial and residential use-per-customer data).
Total Commercial Sales
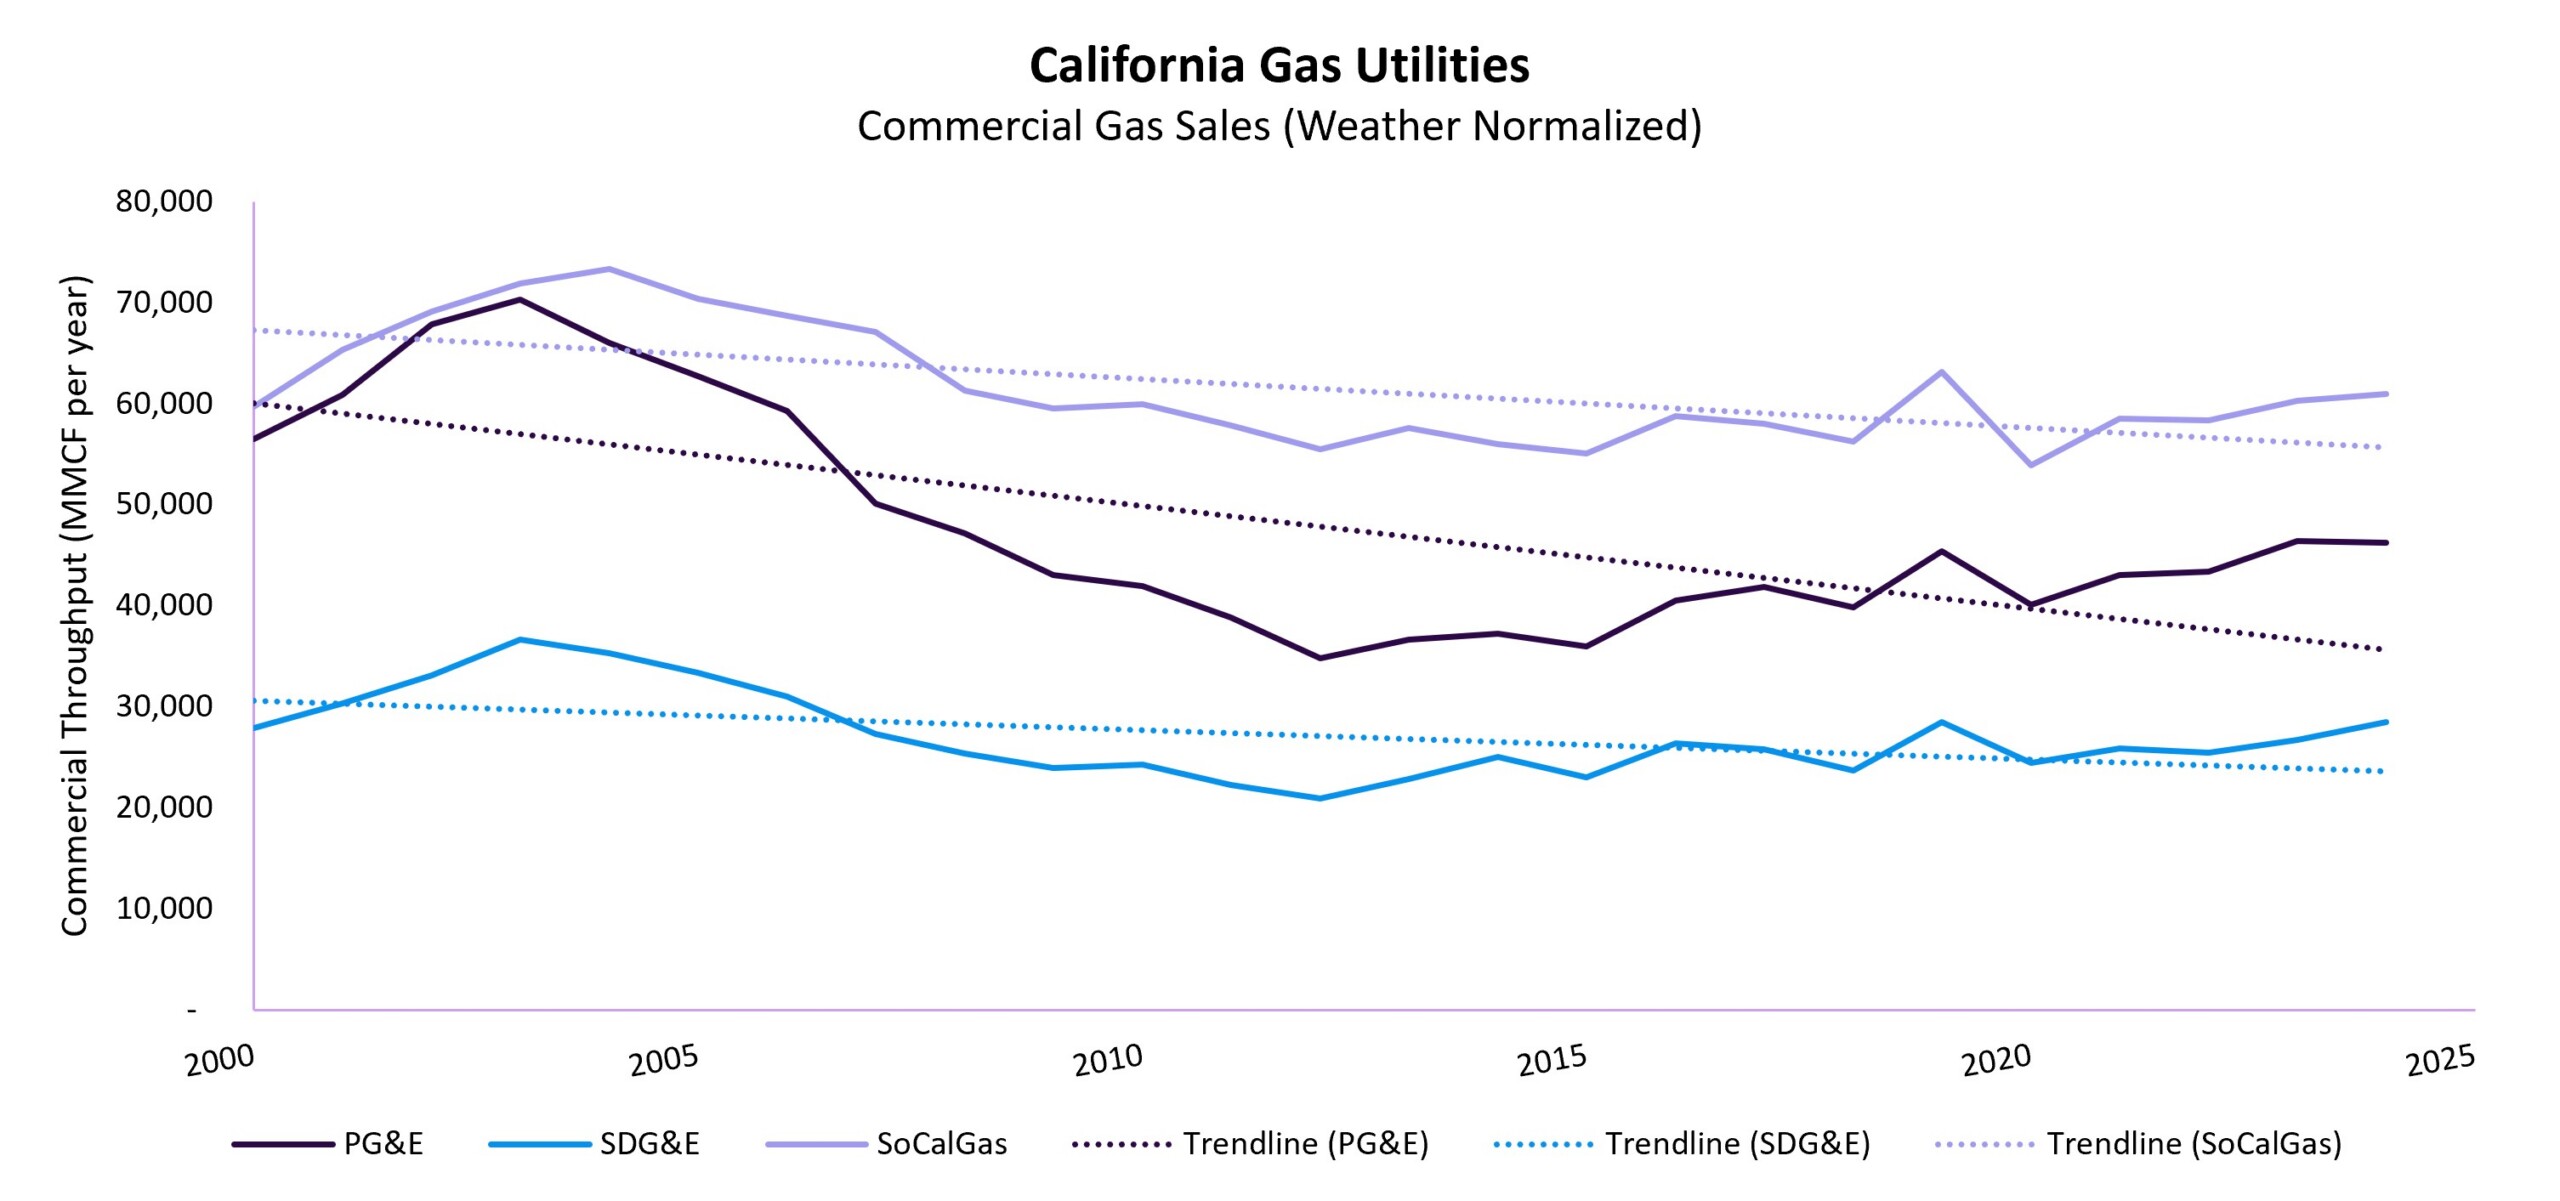
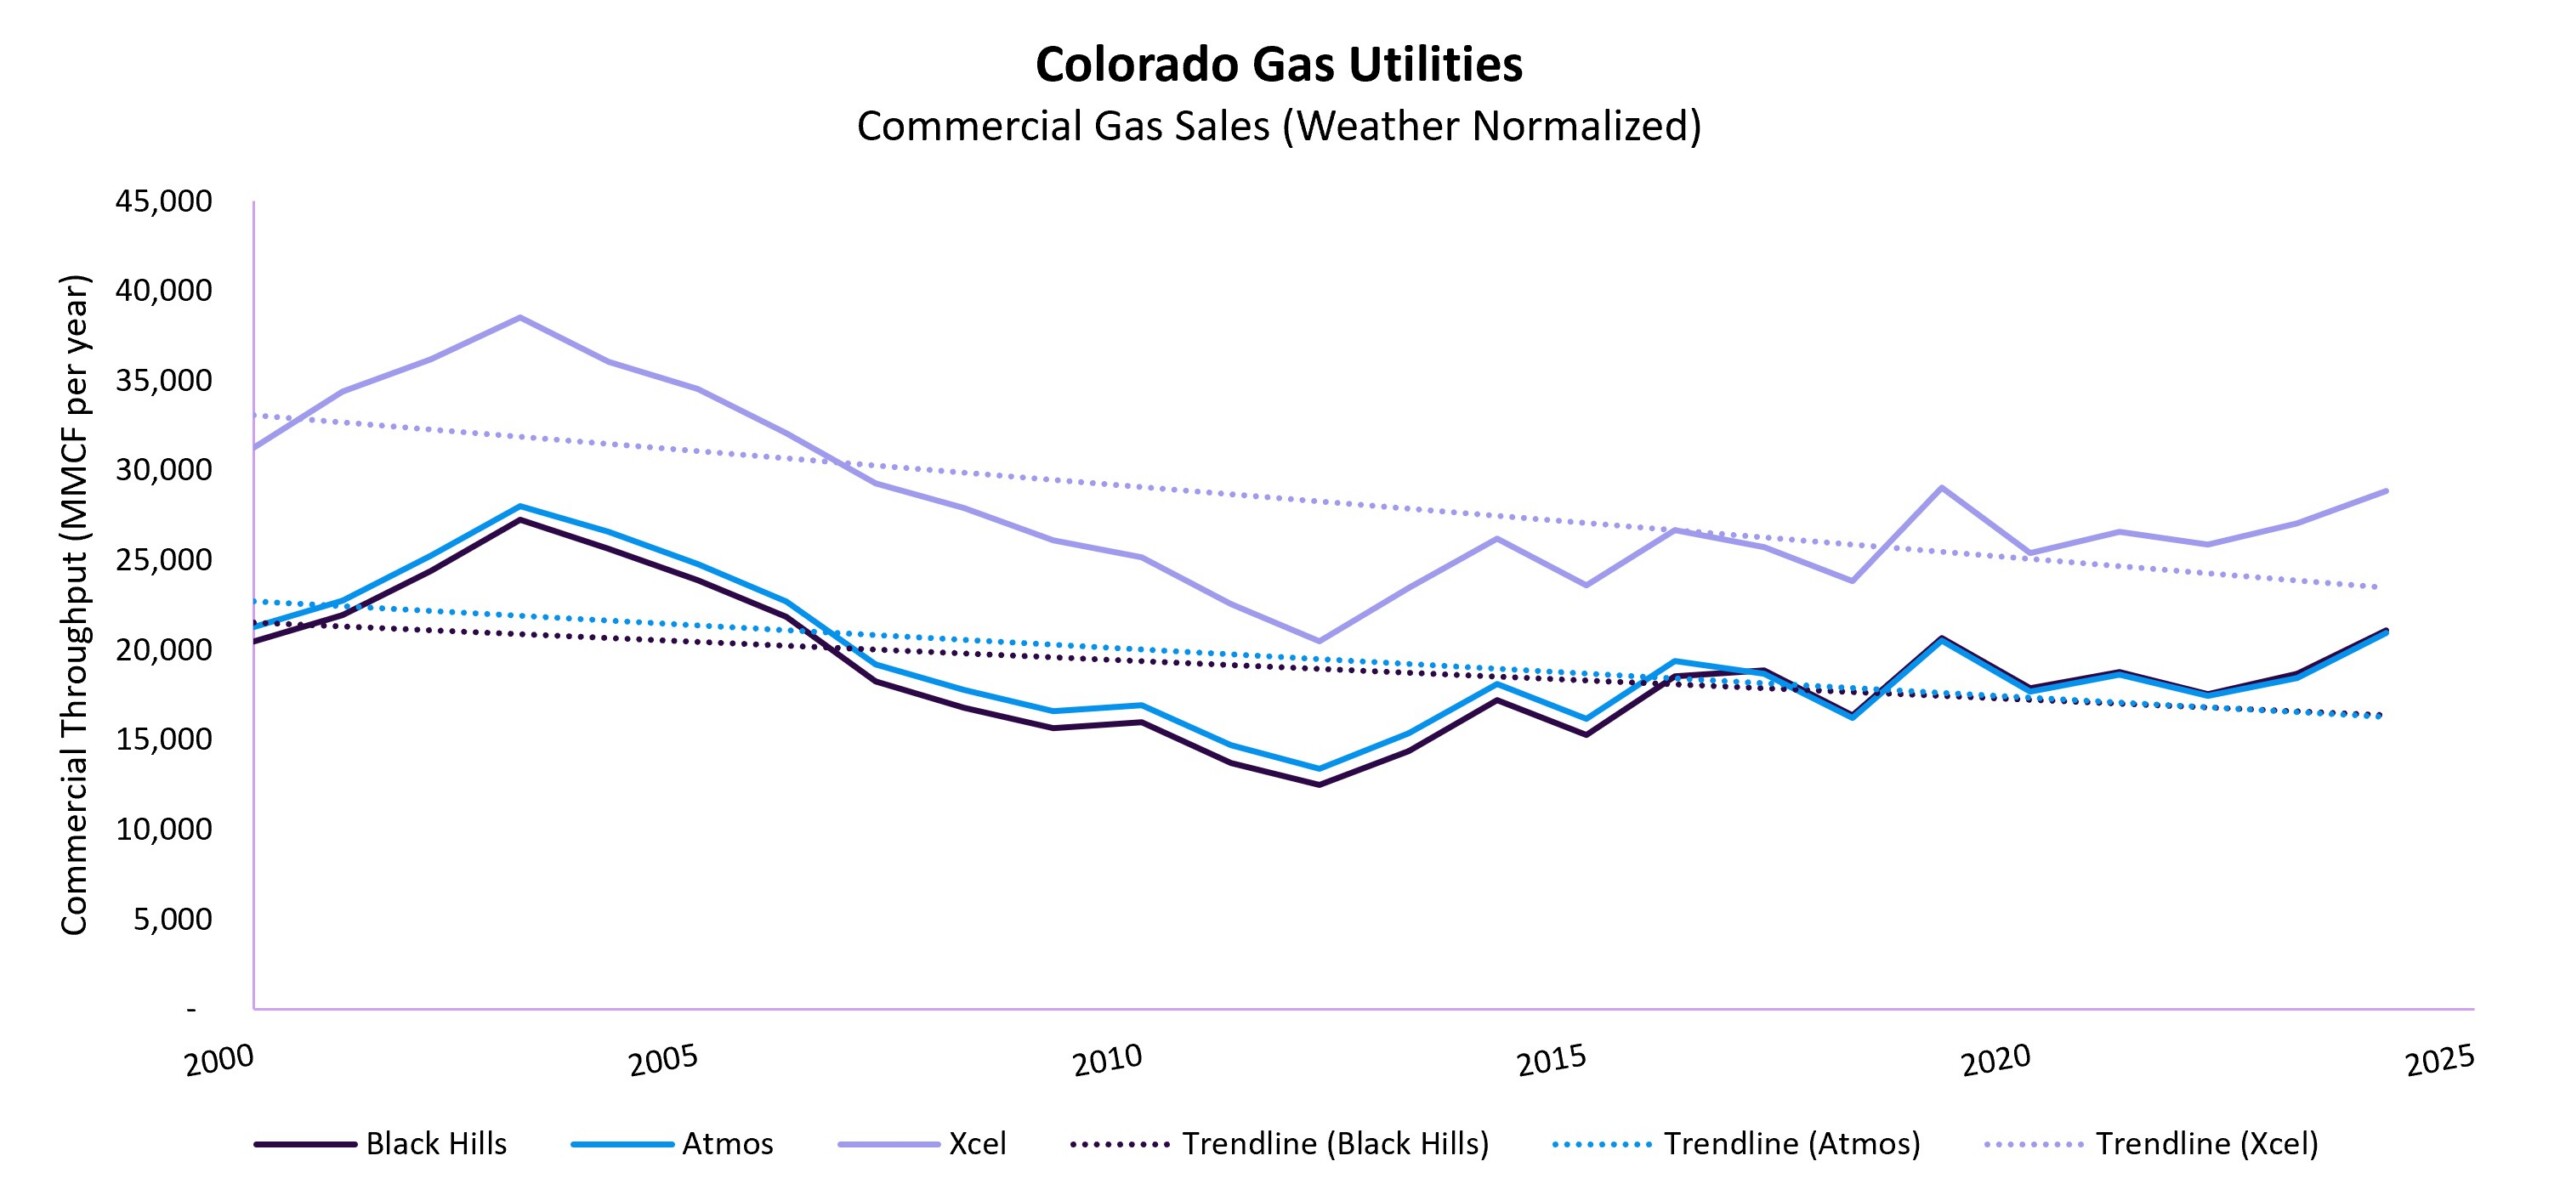
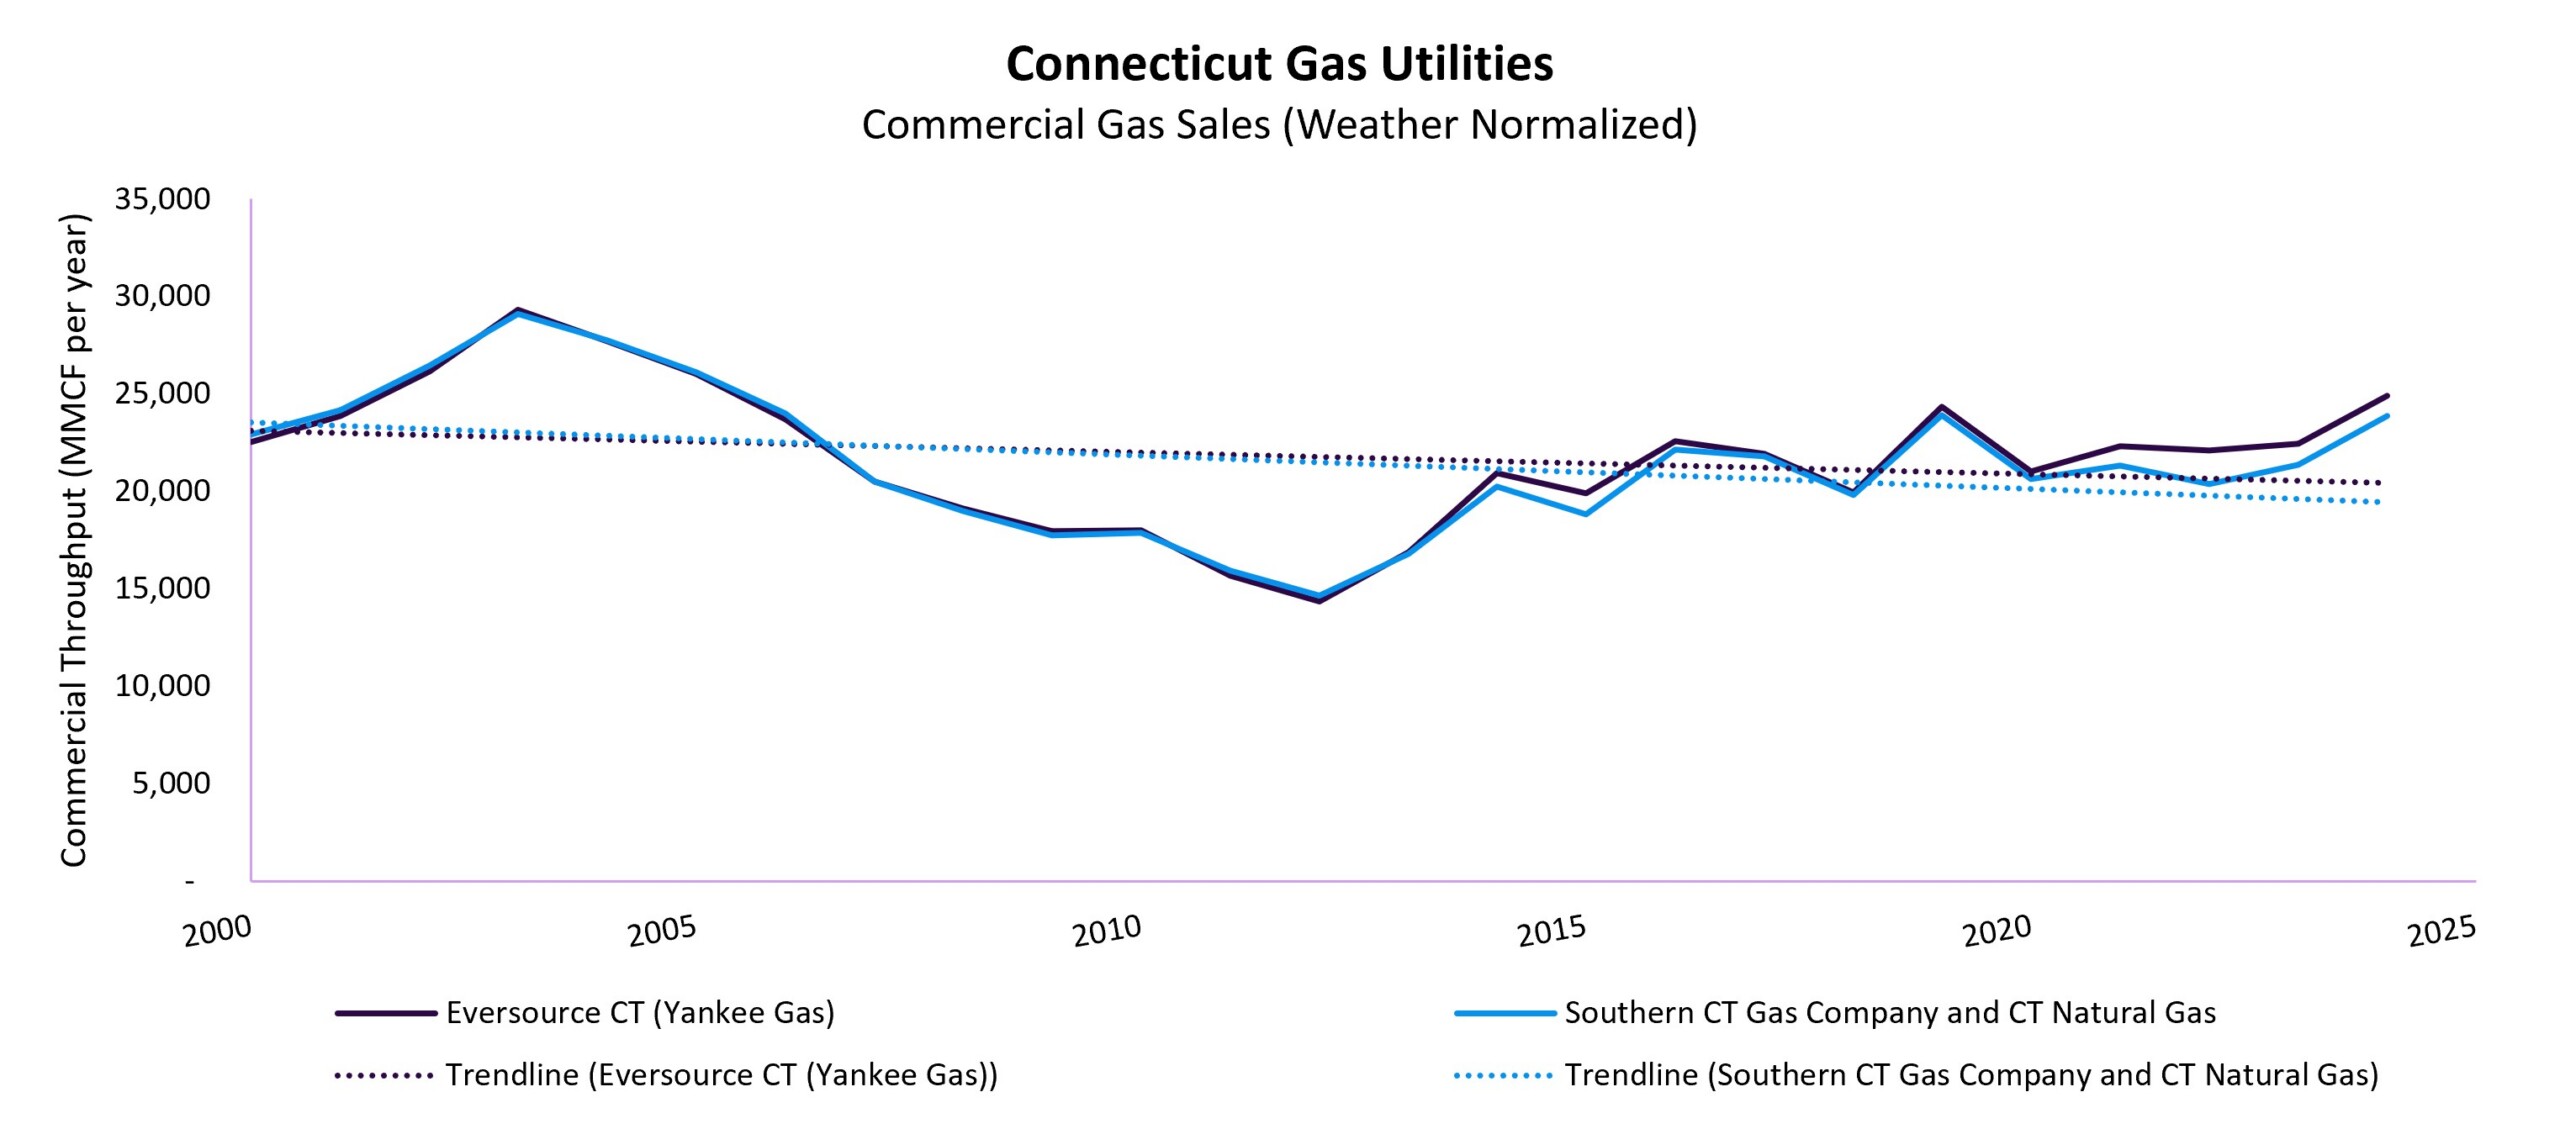
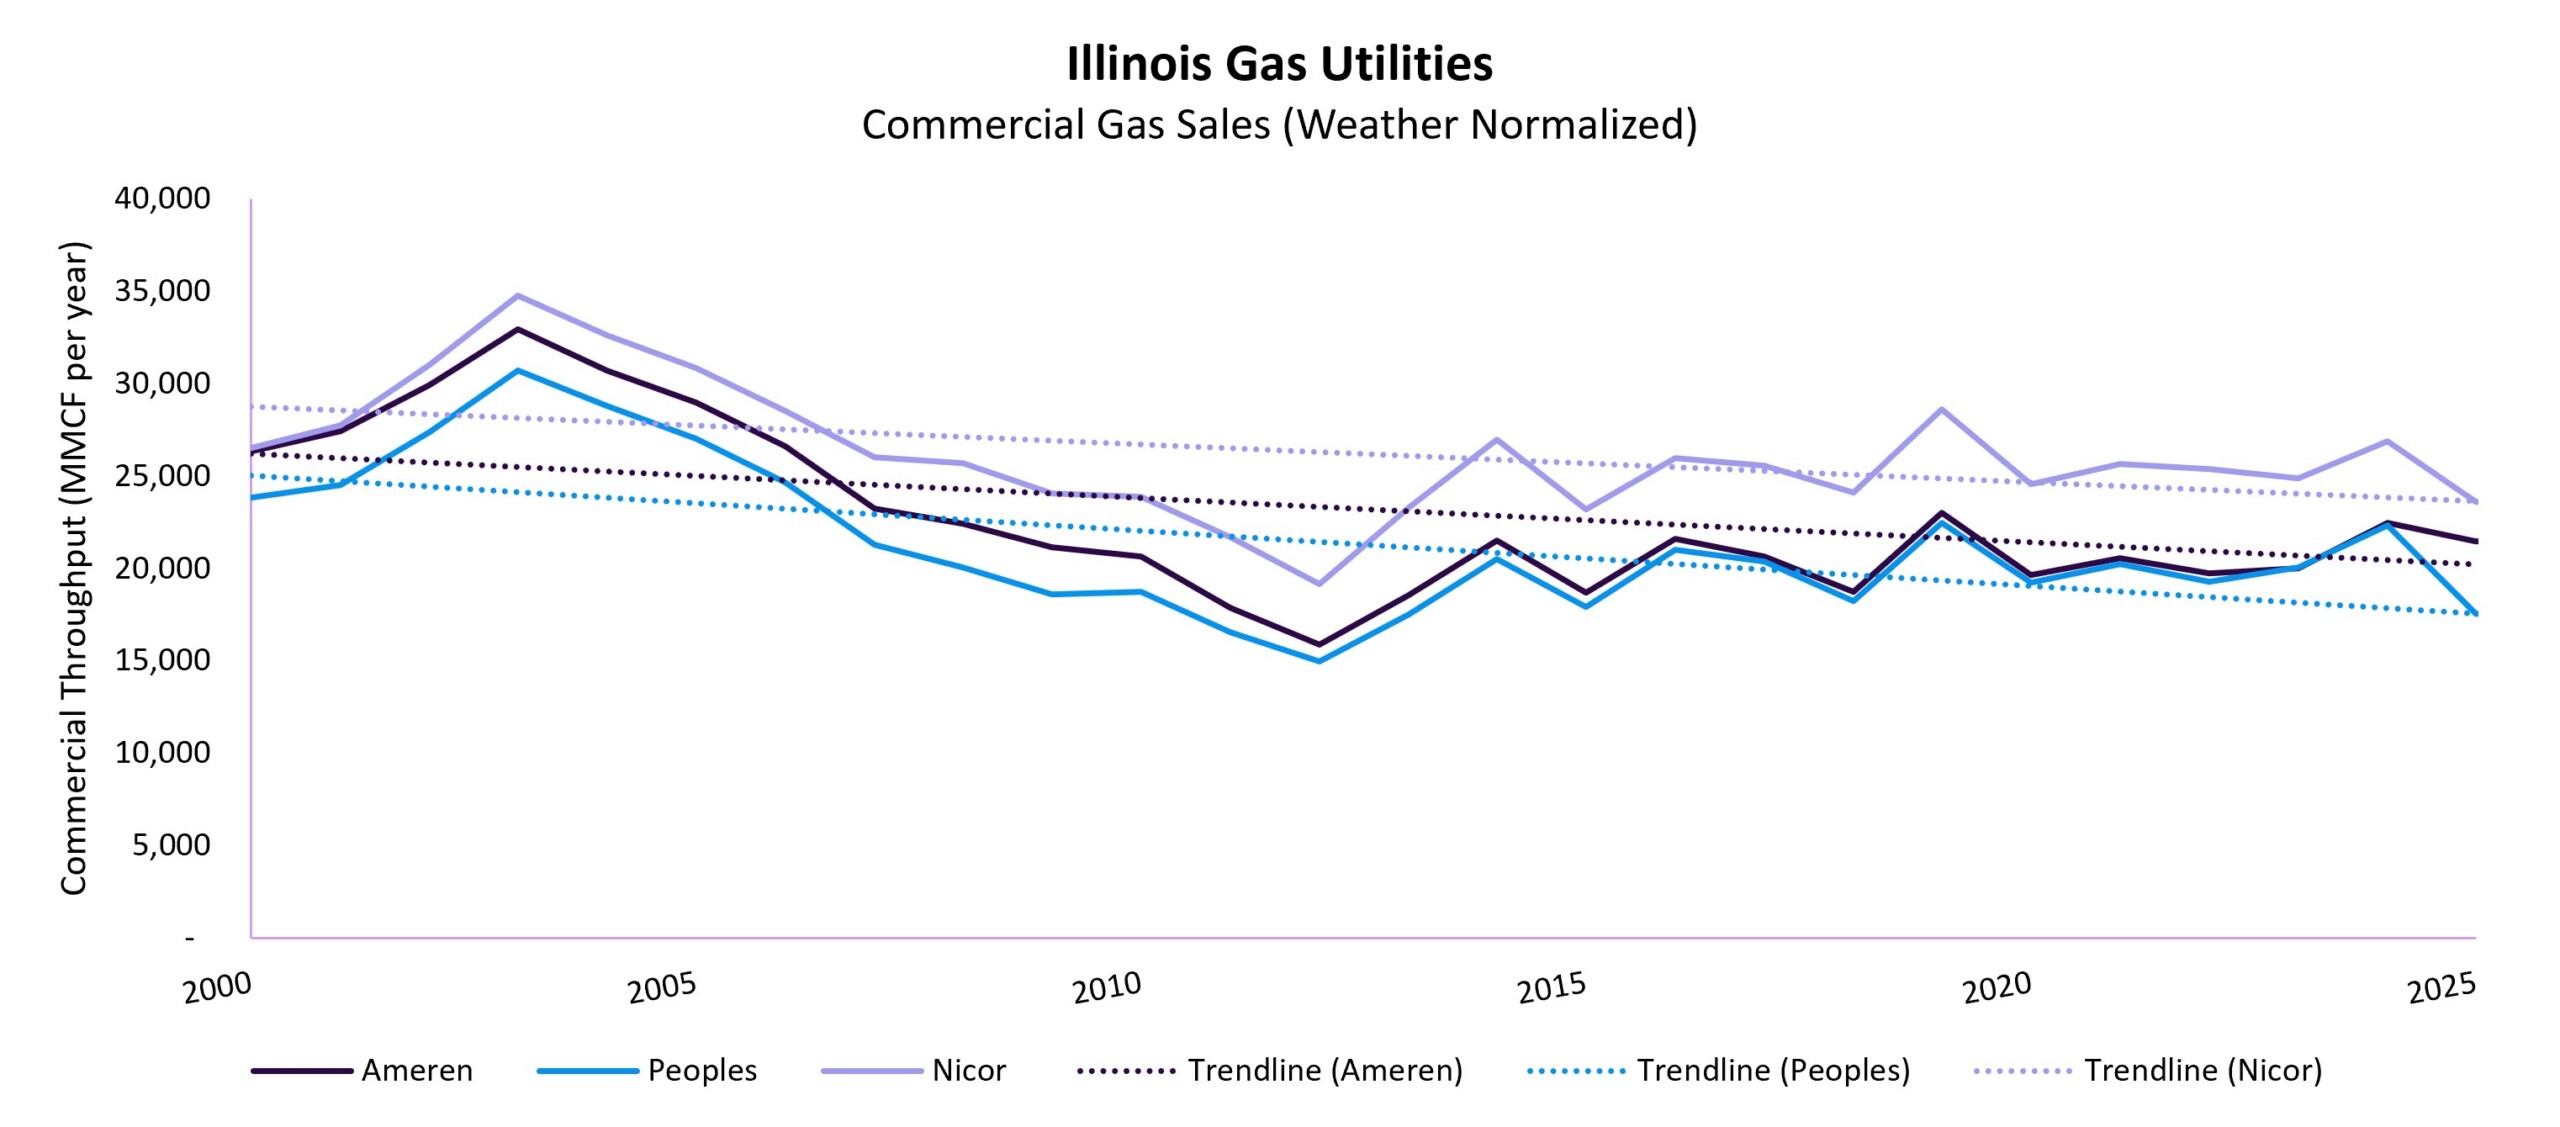
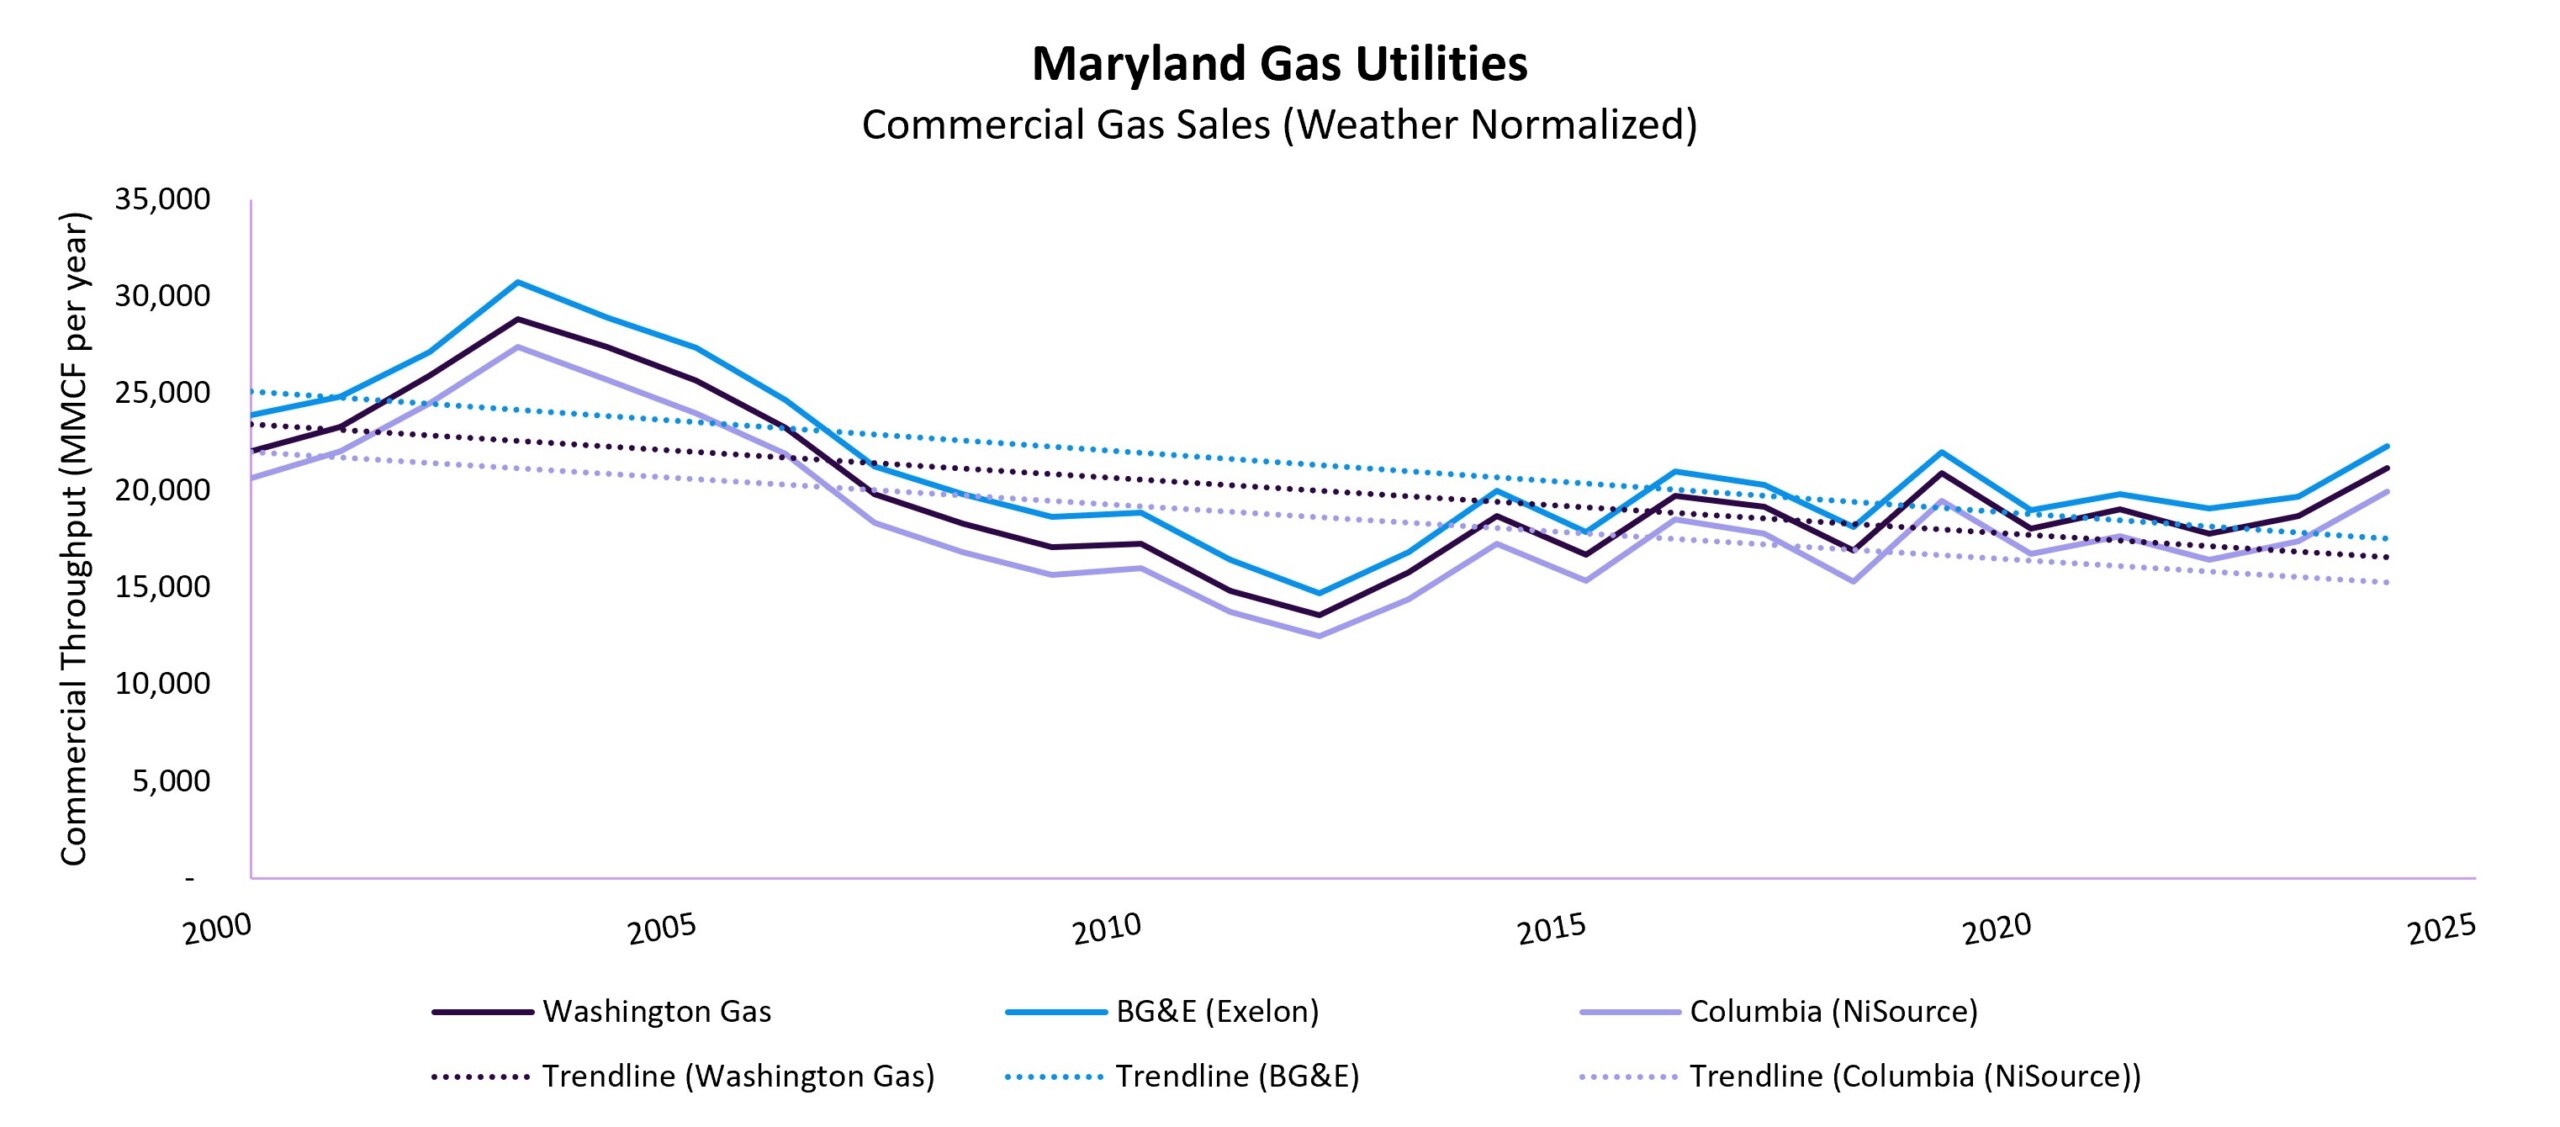
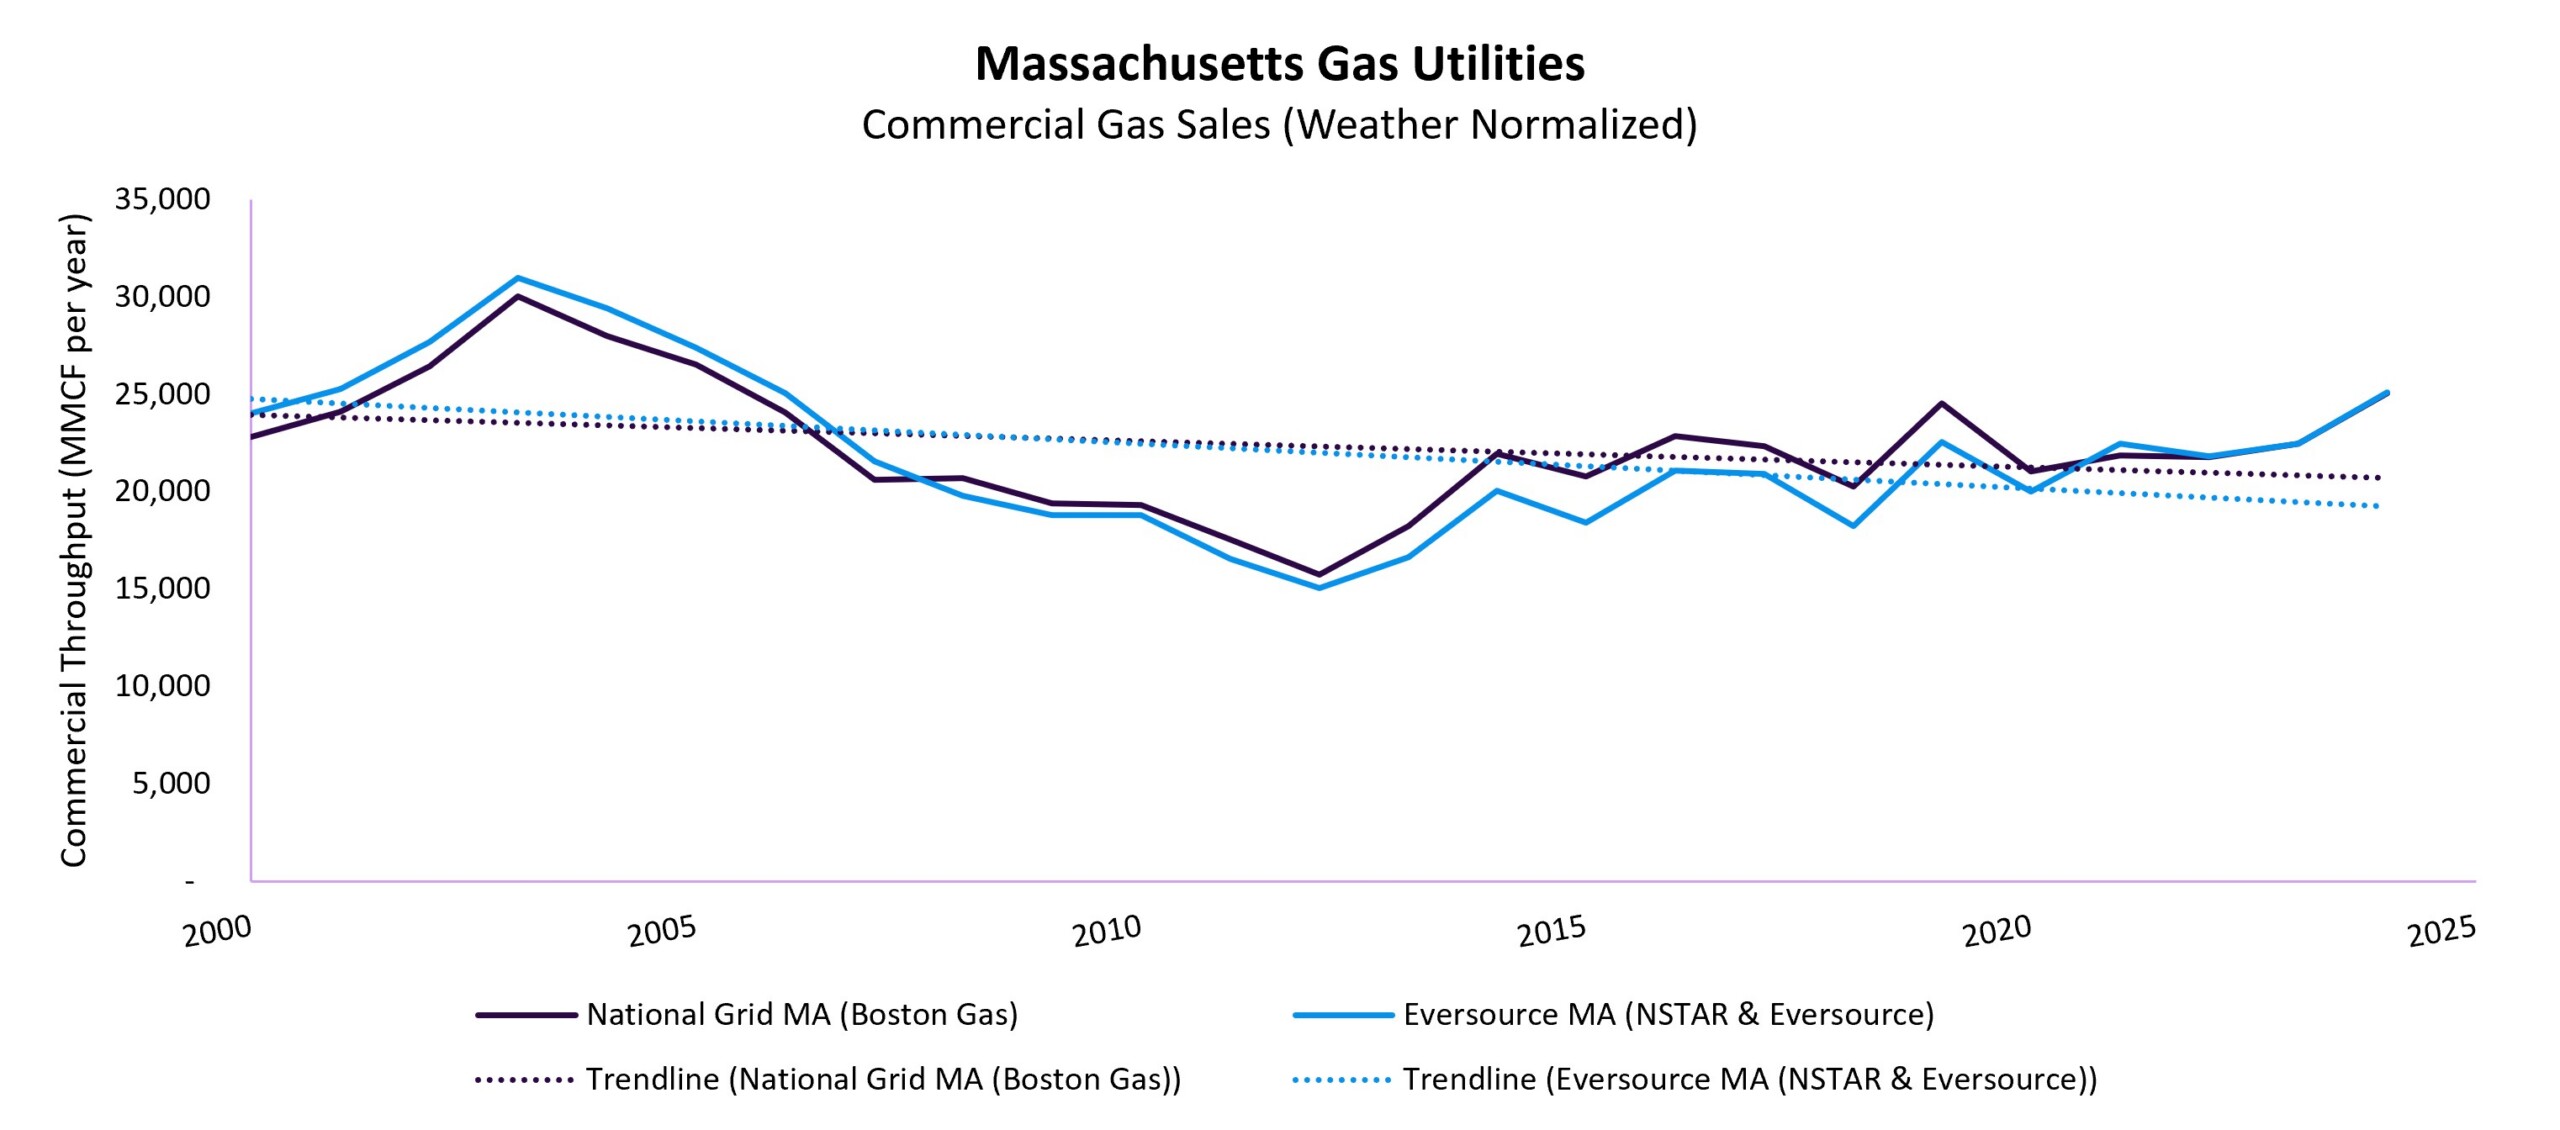
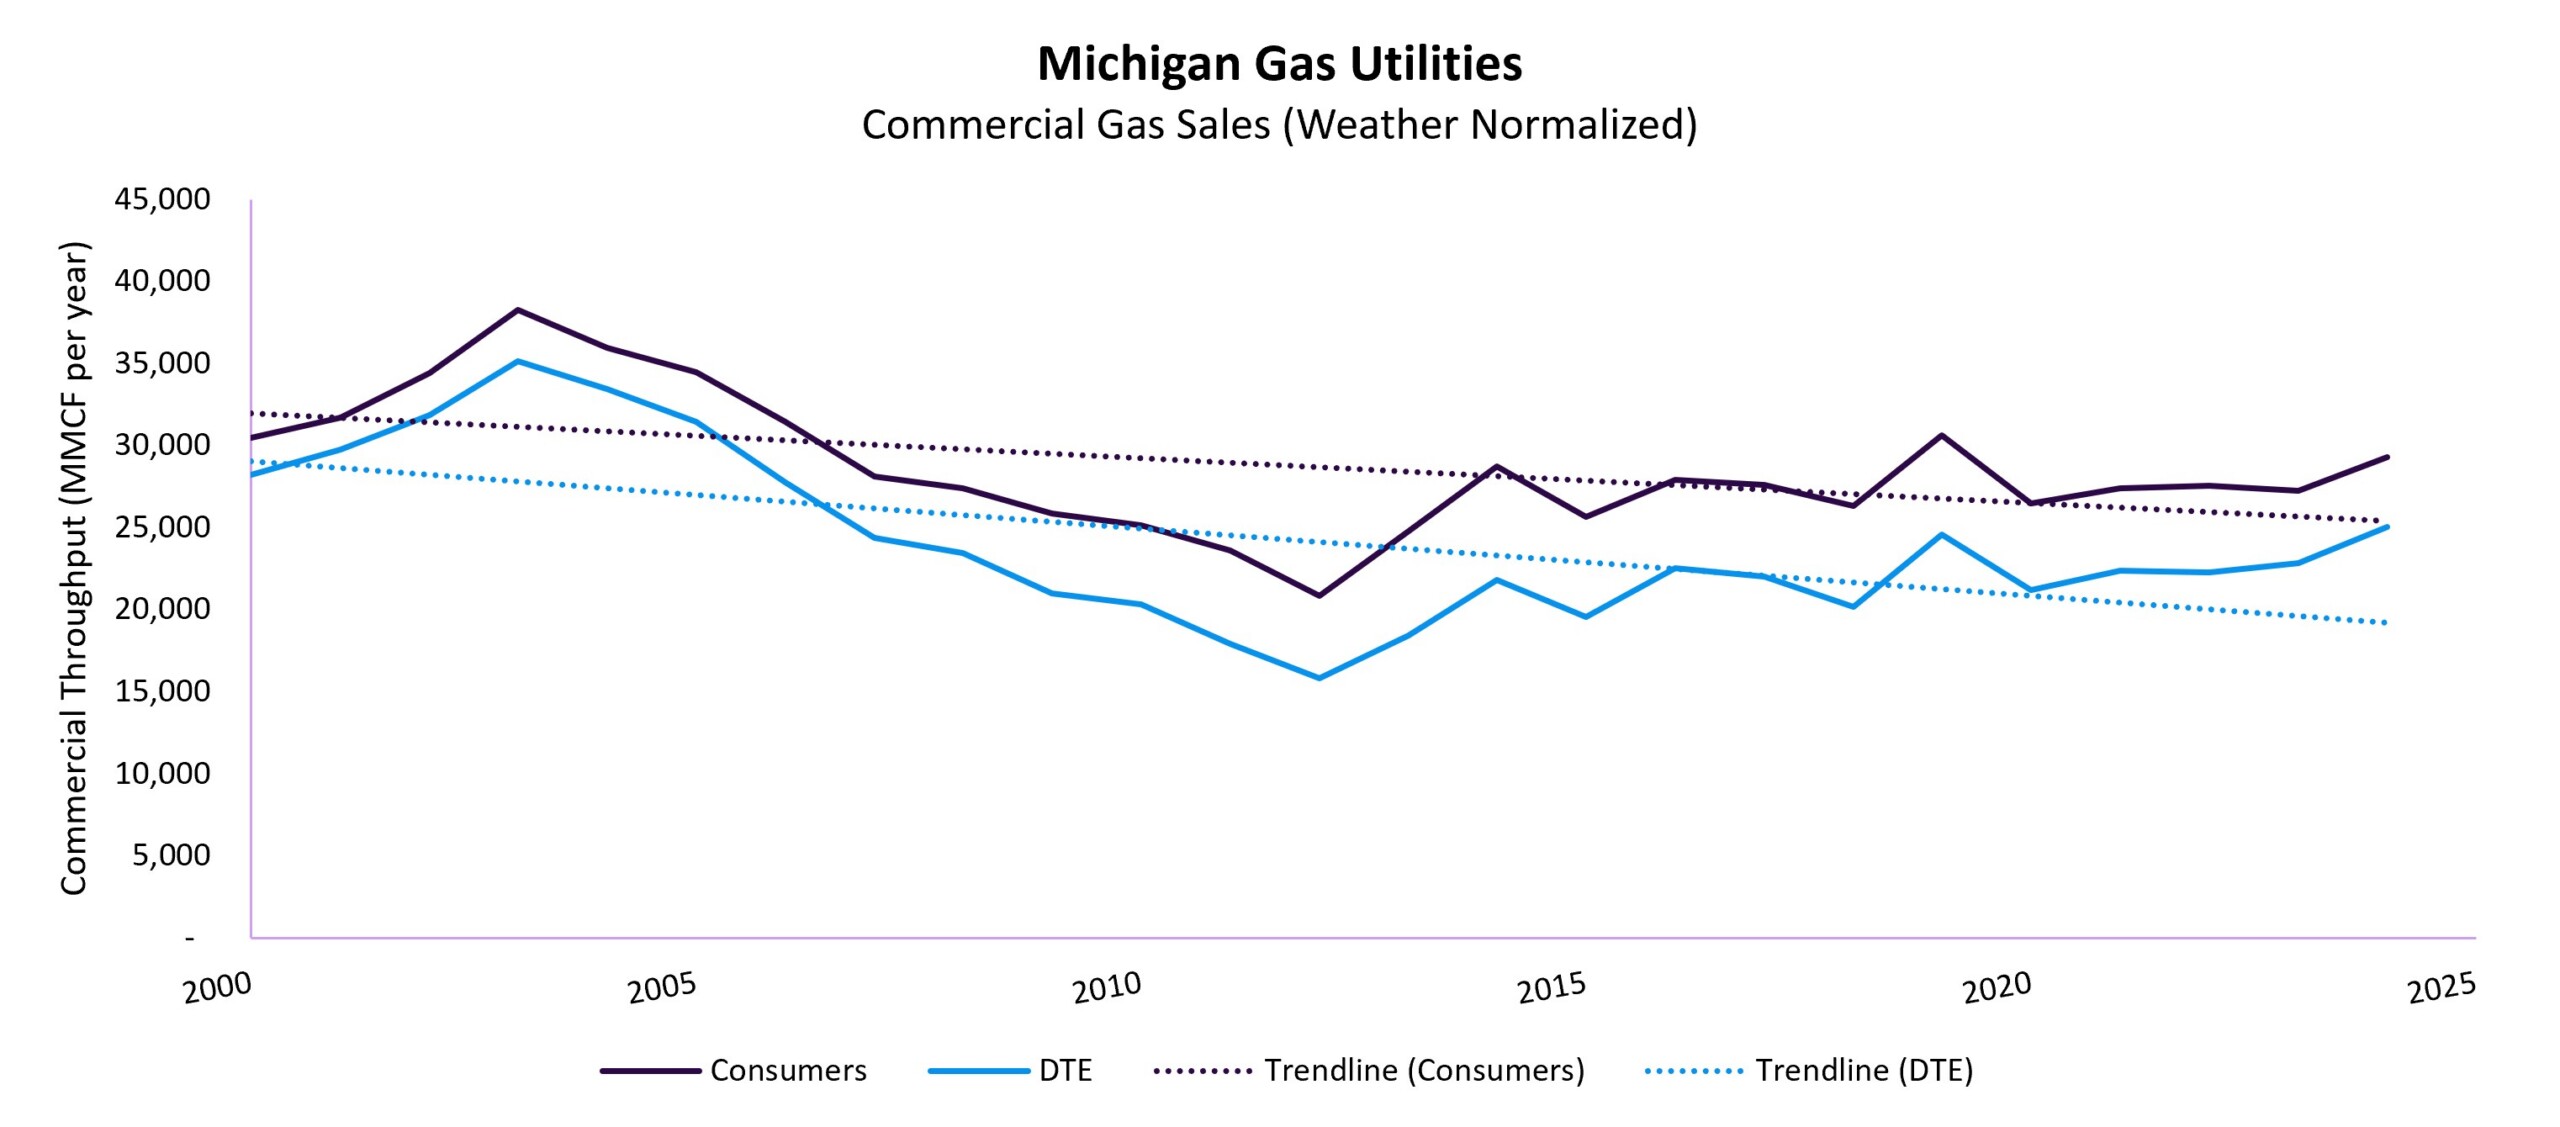
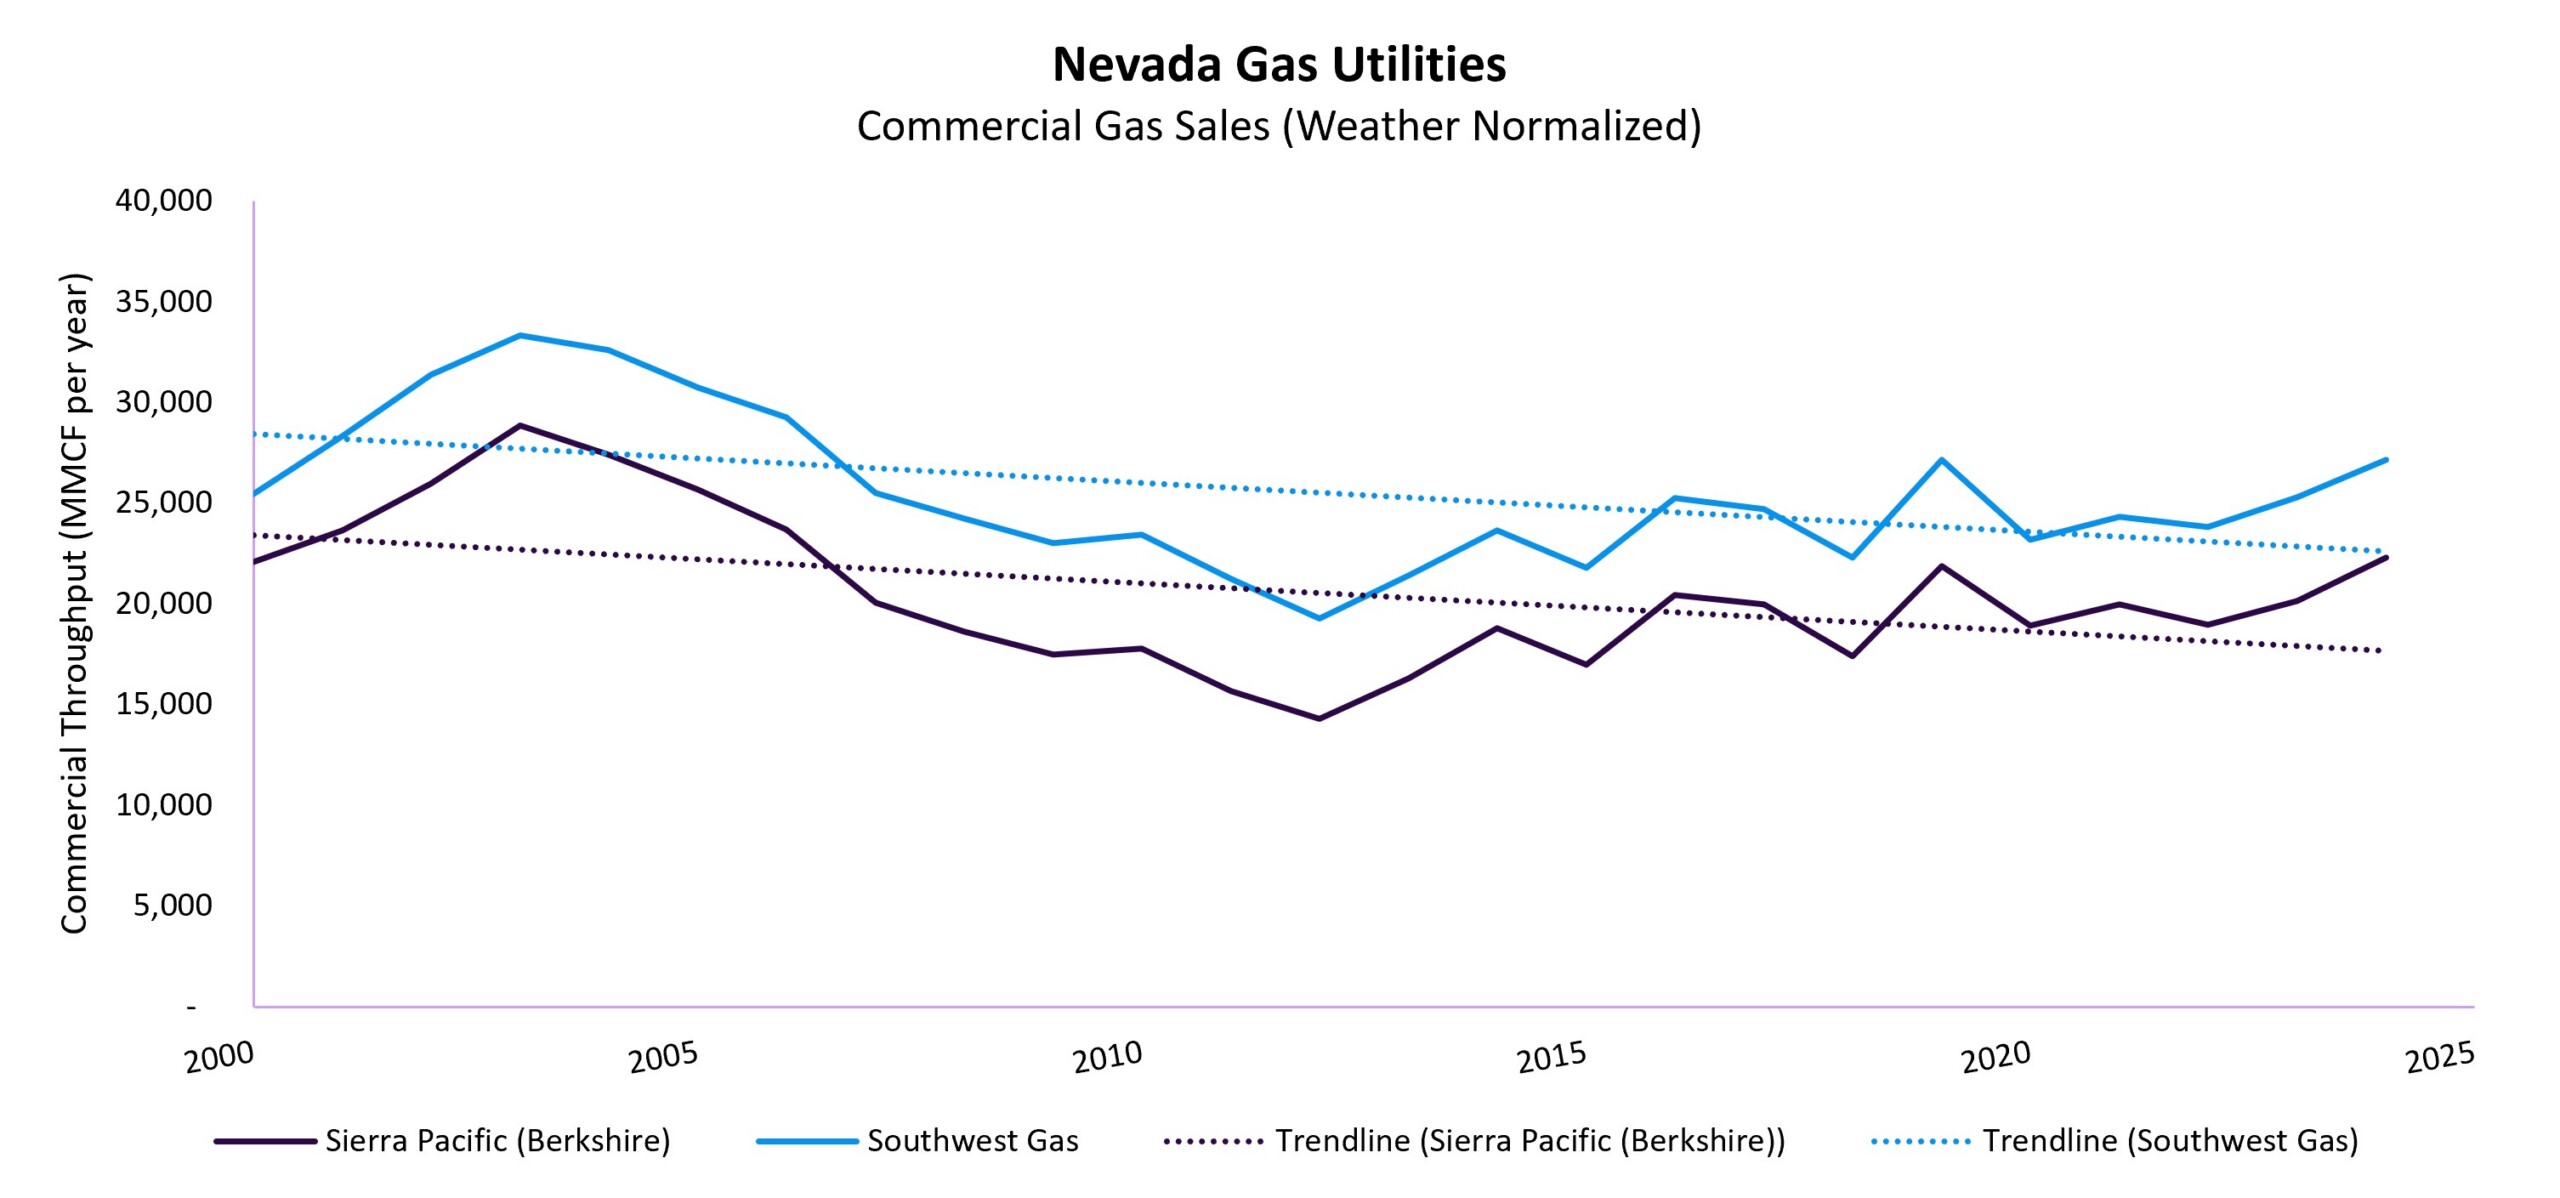
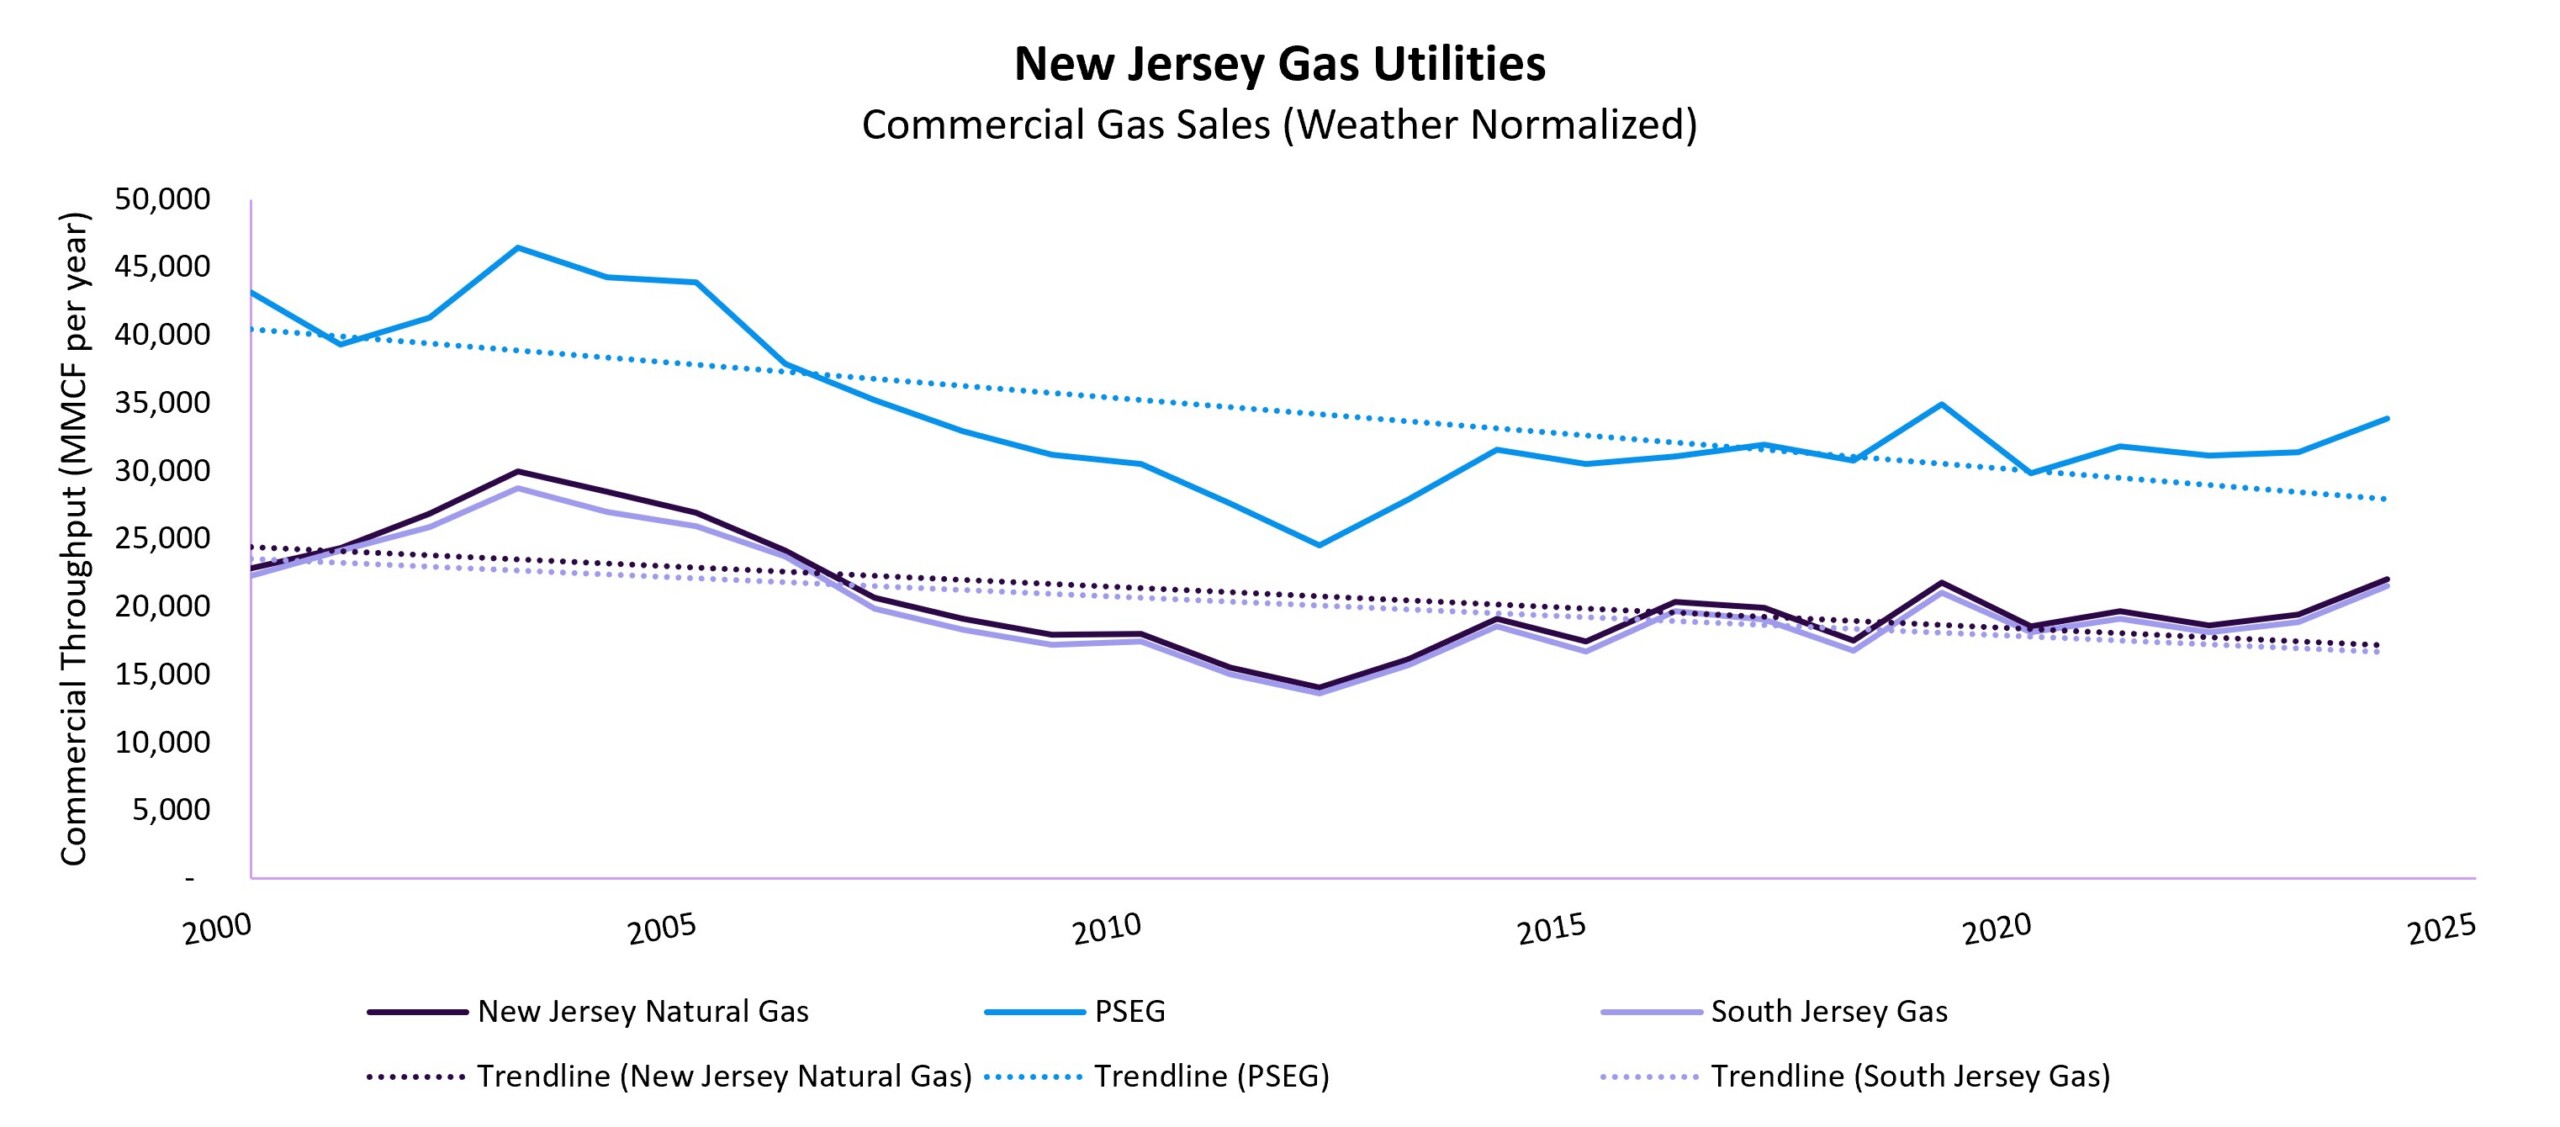
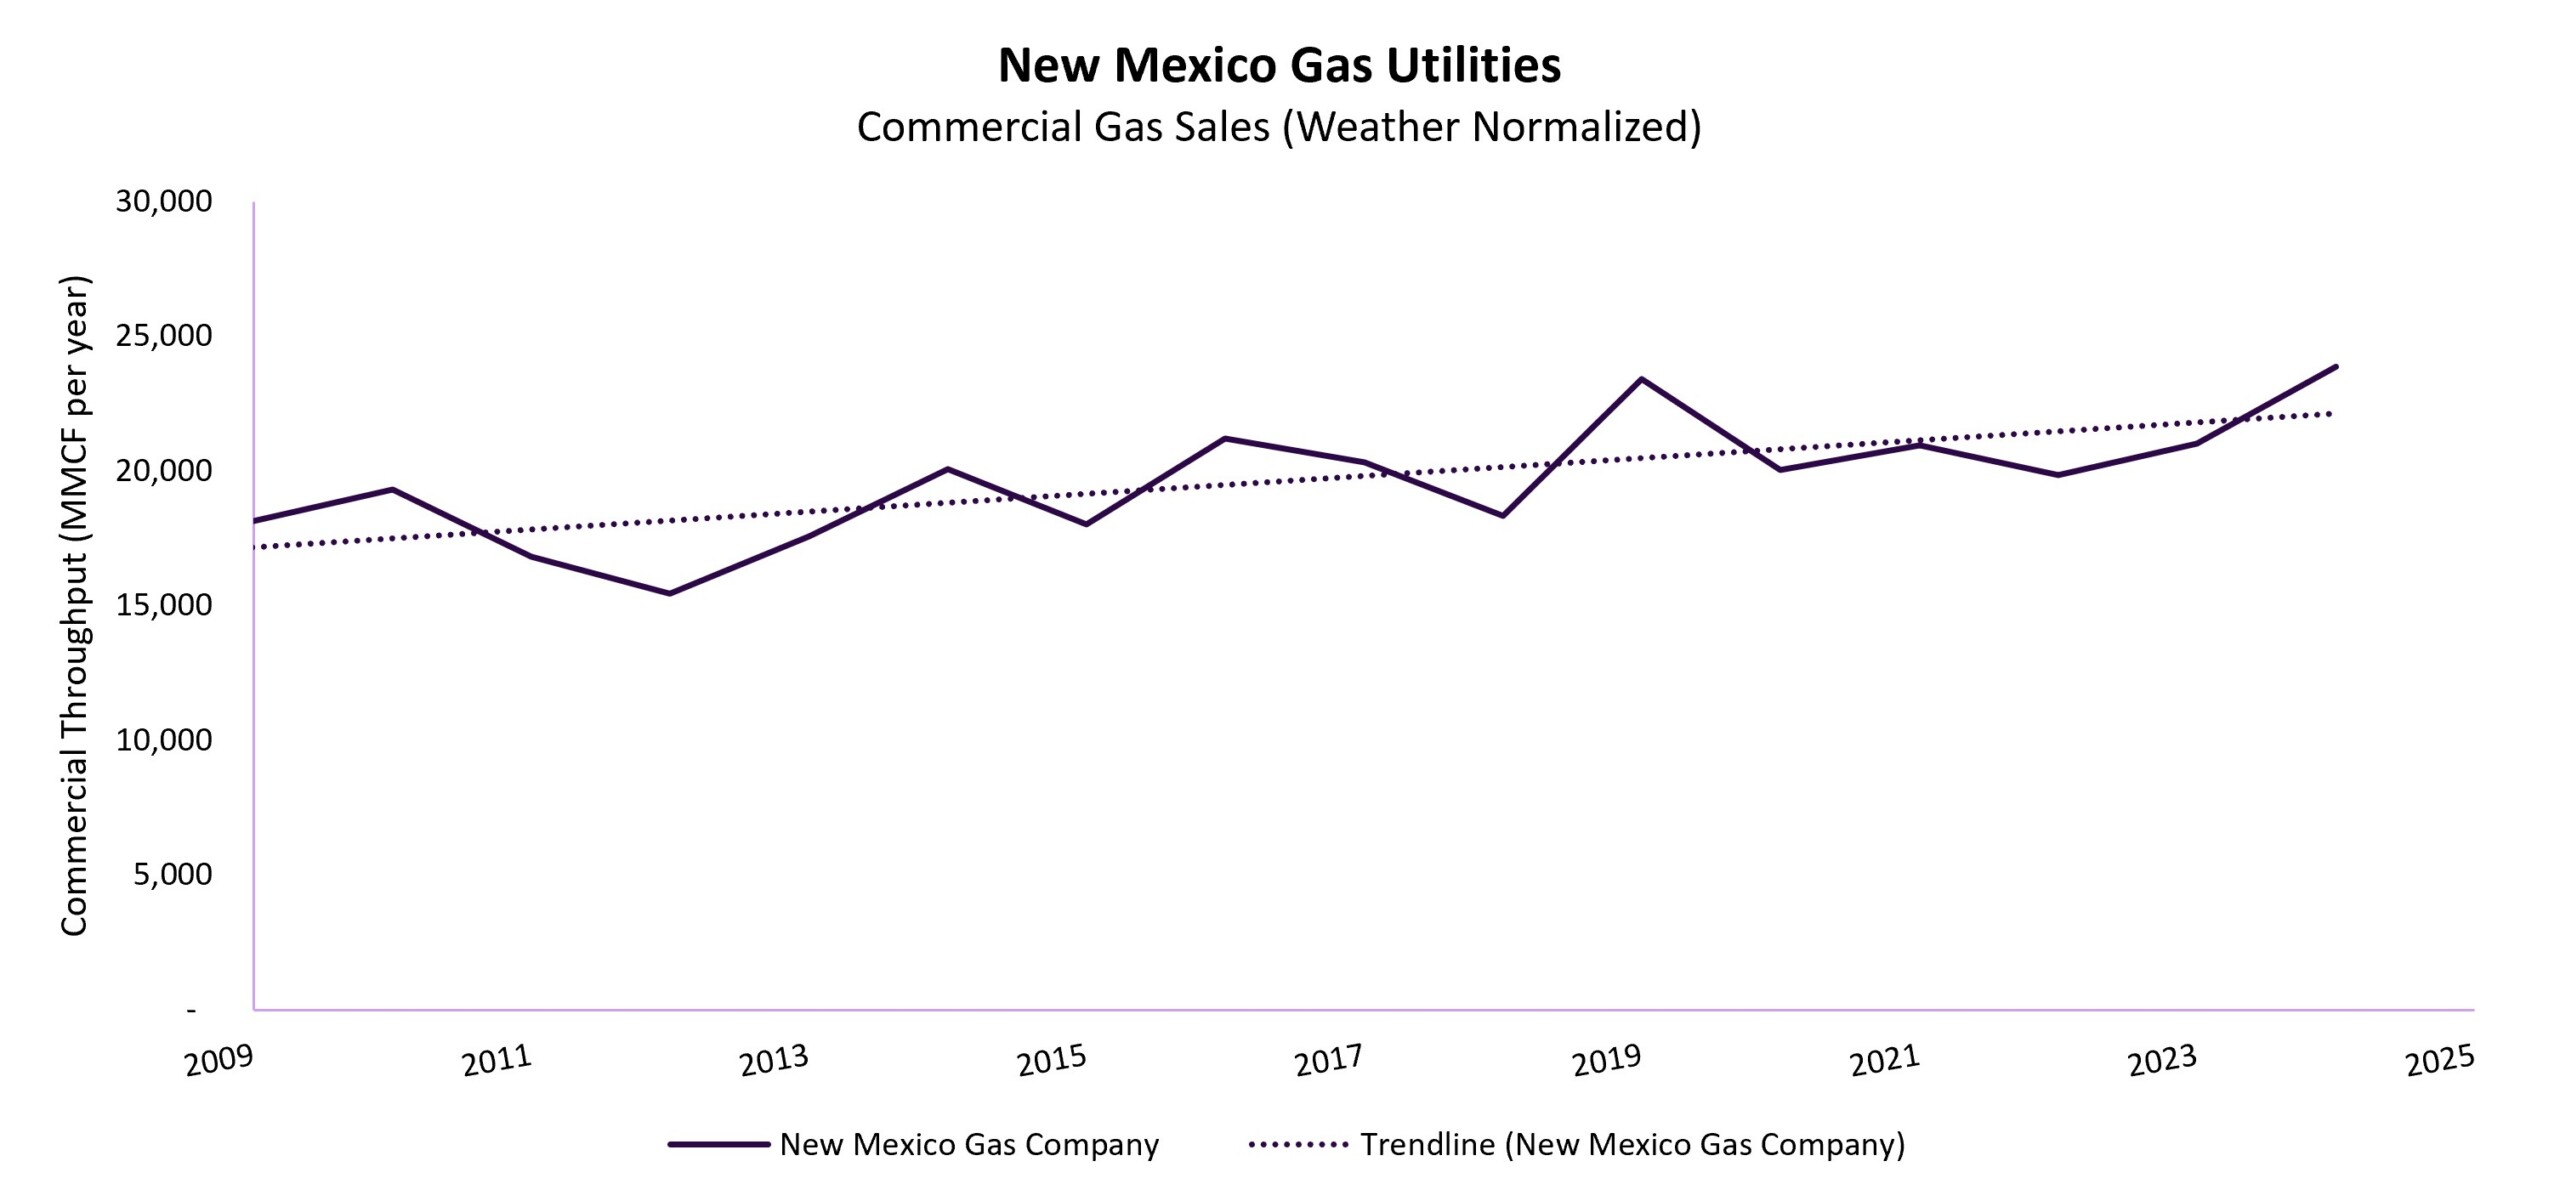
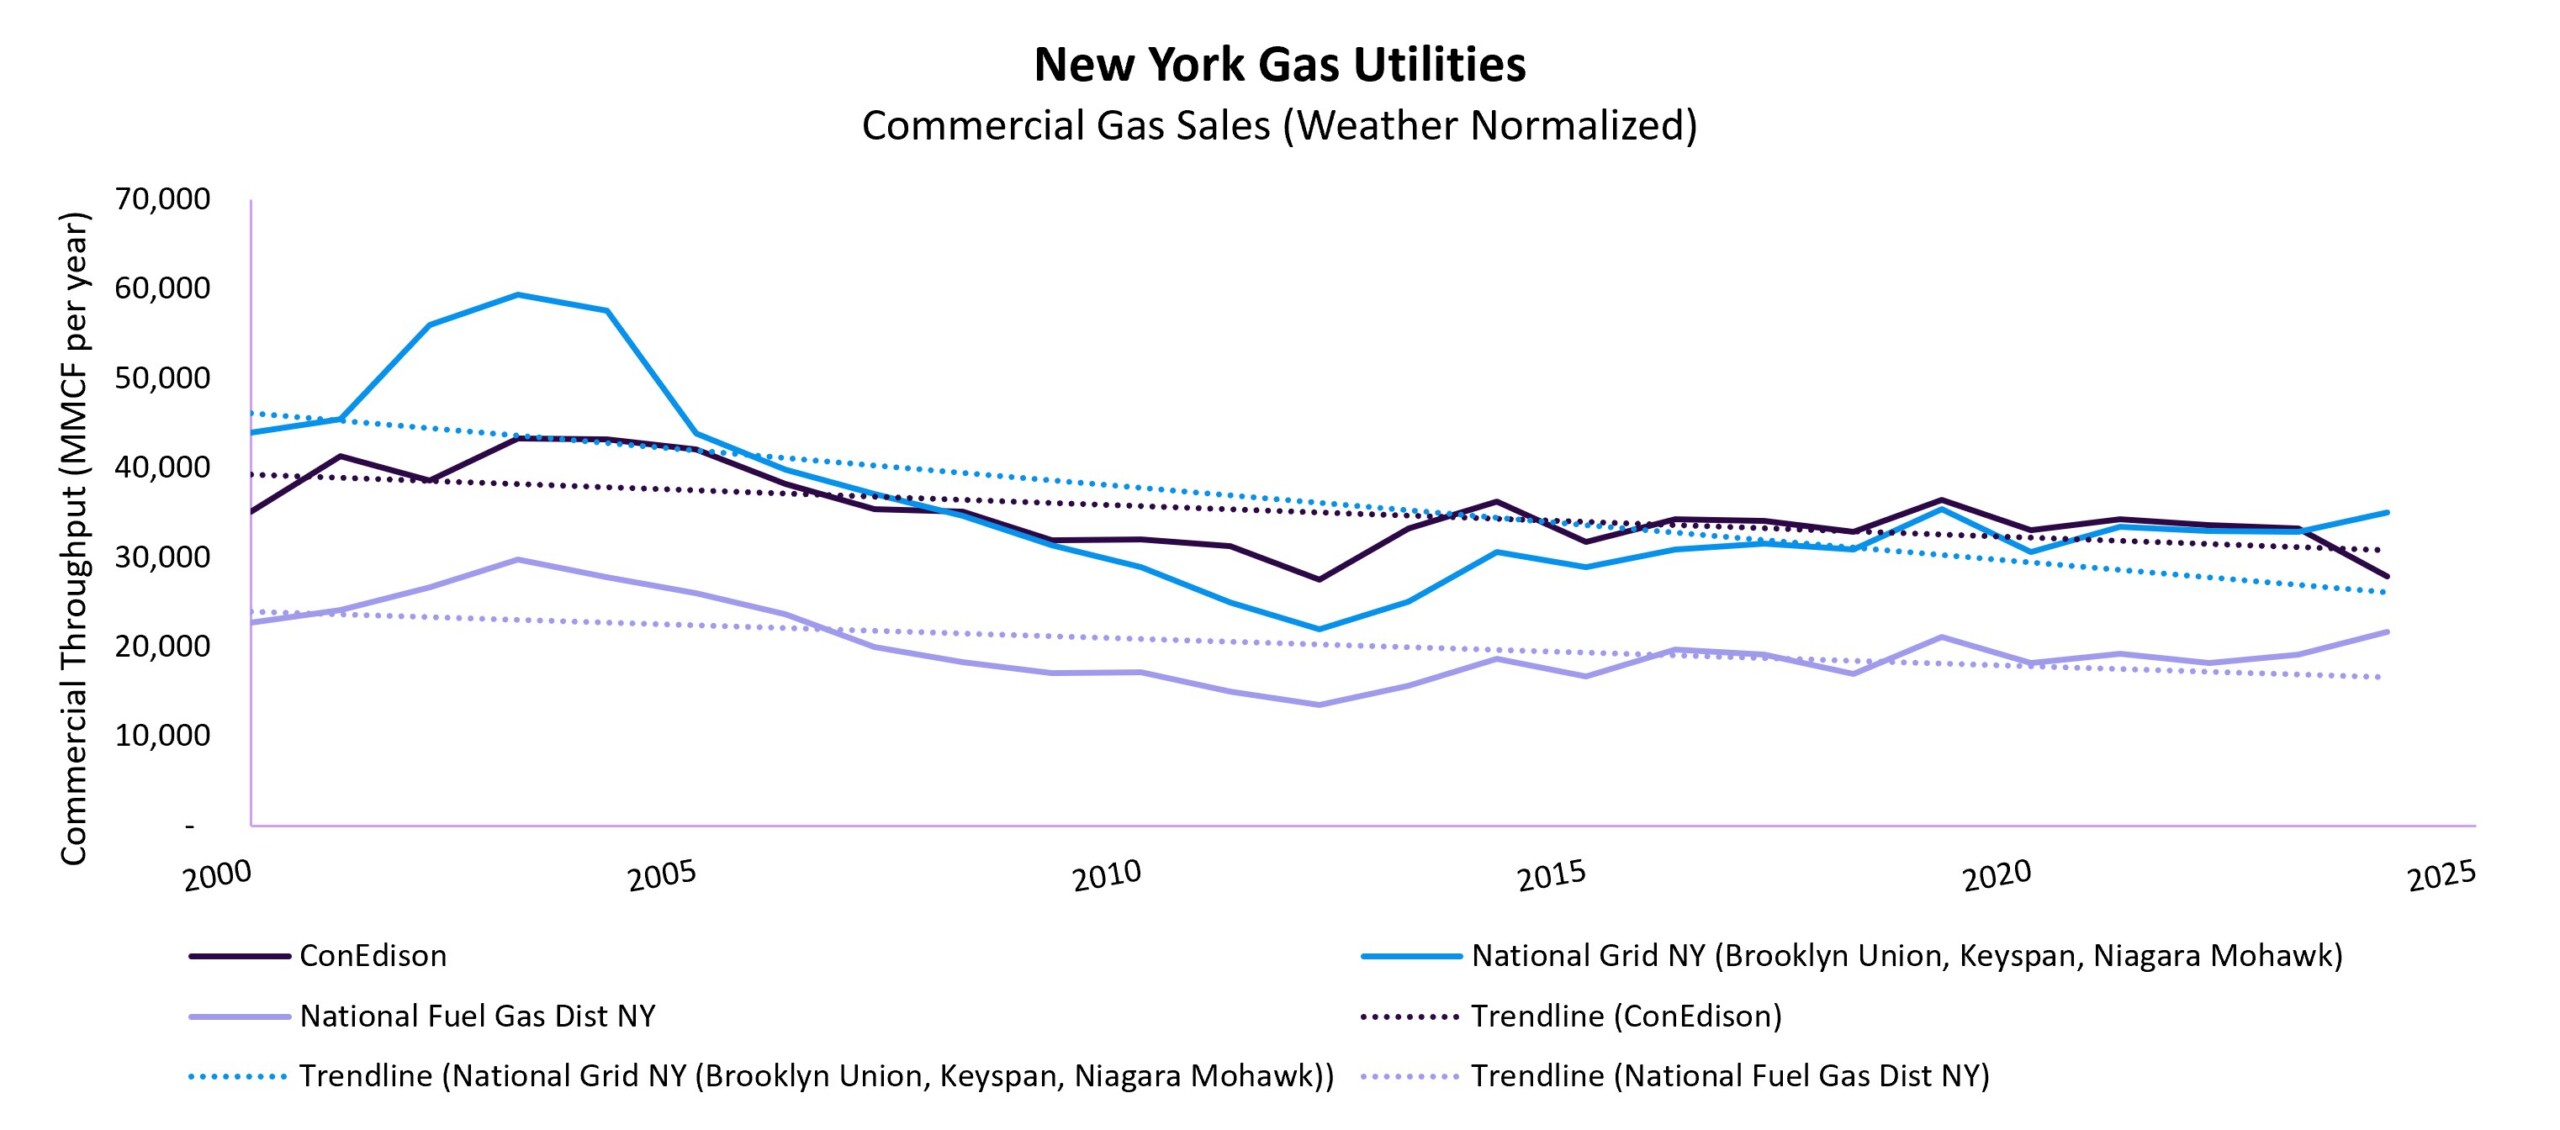
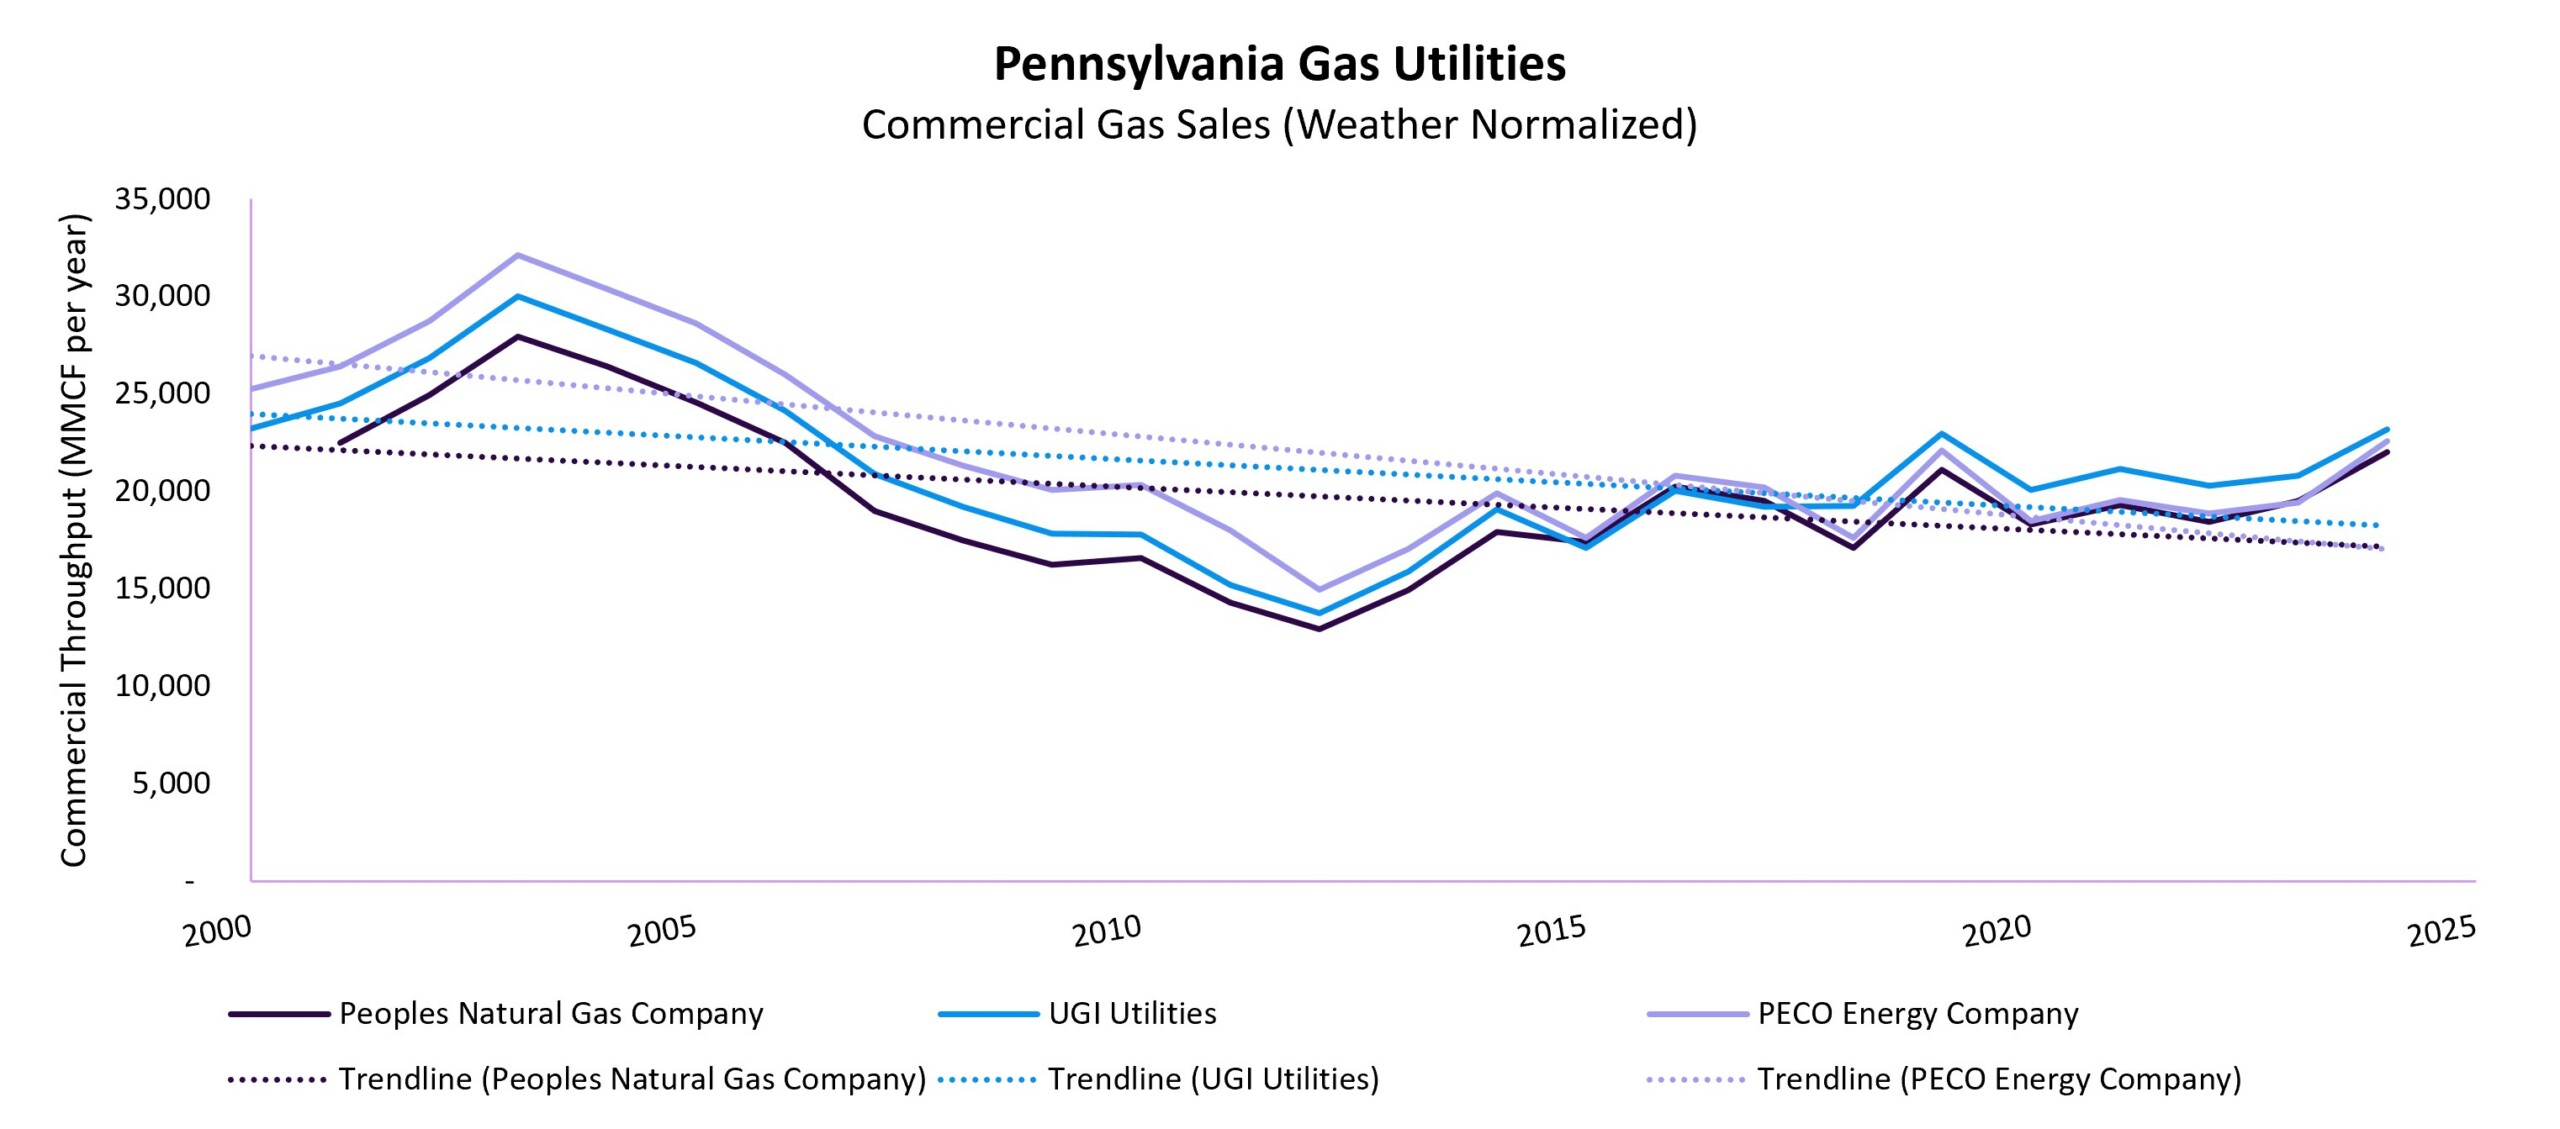
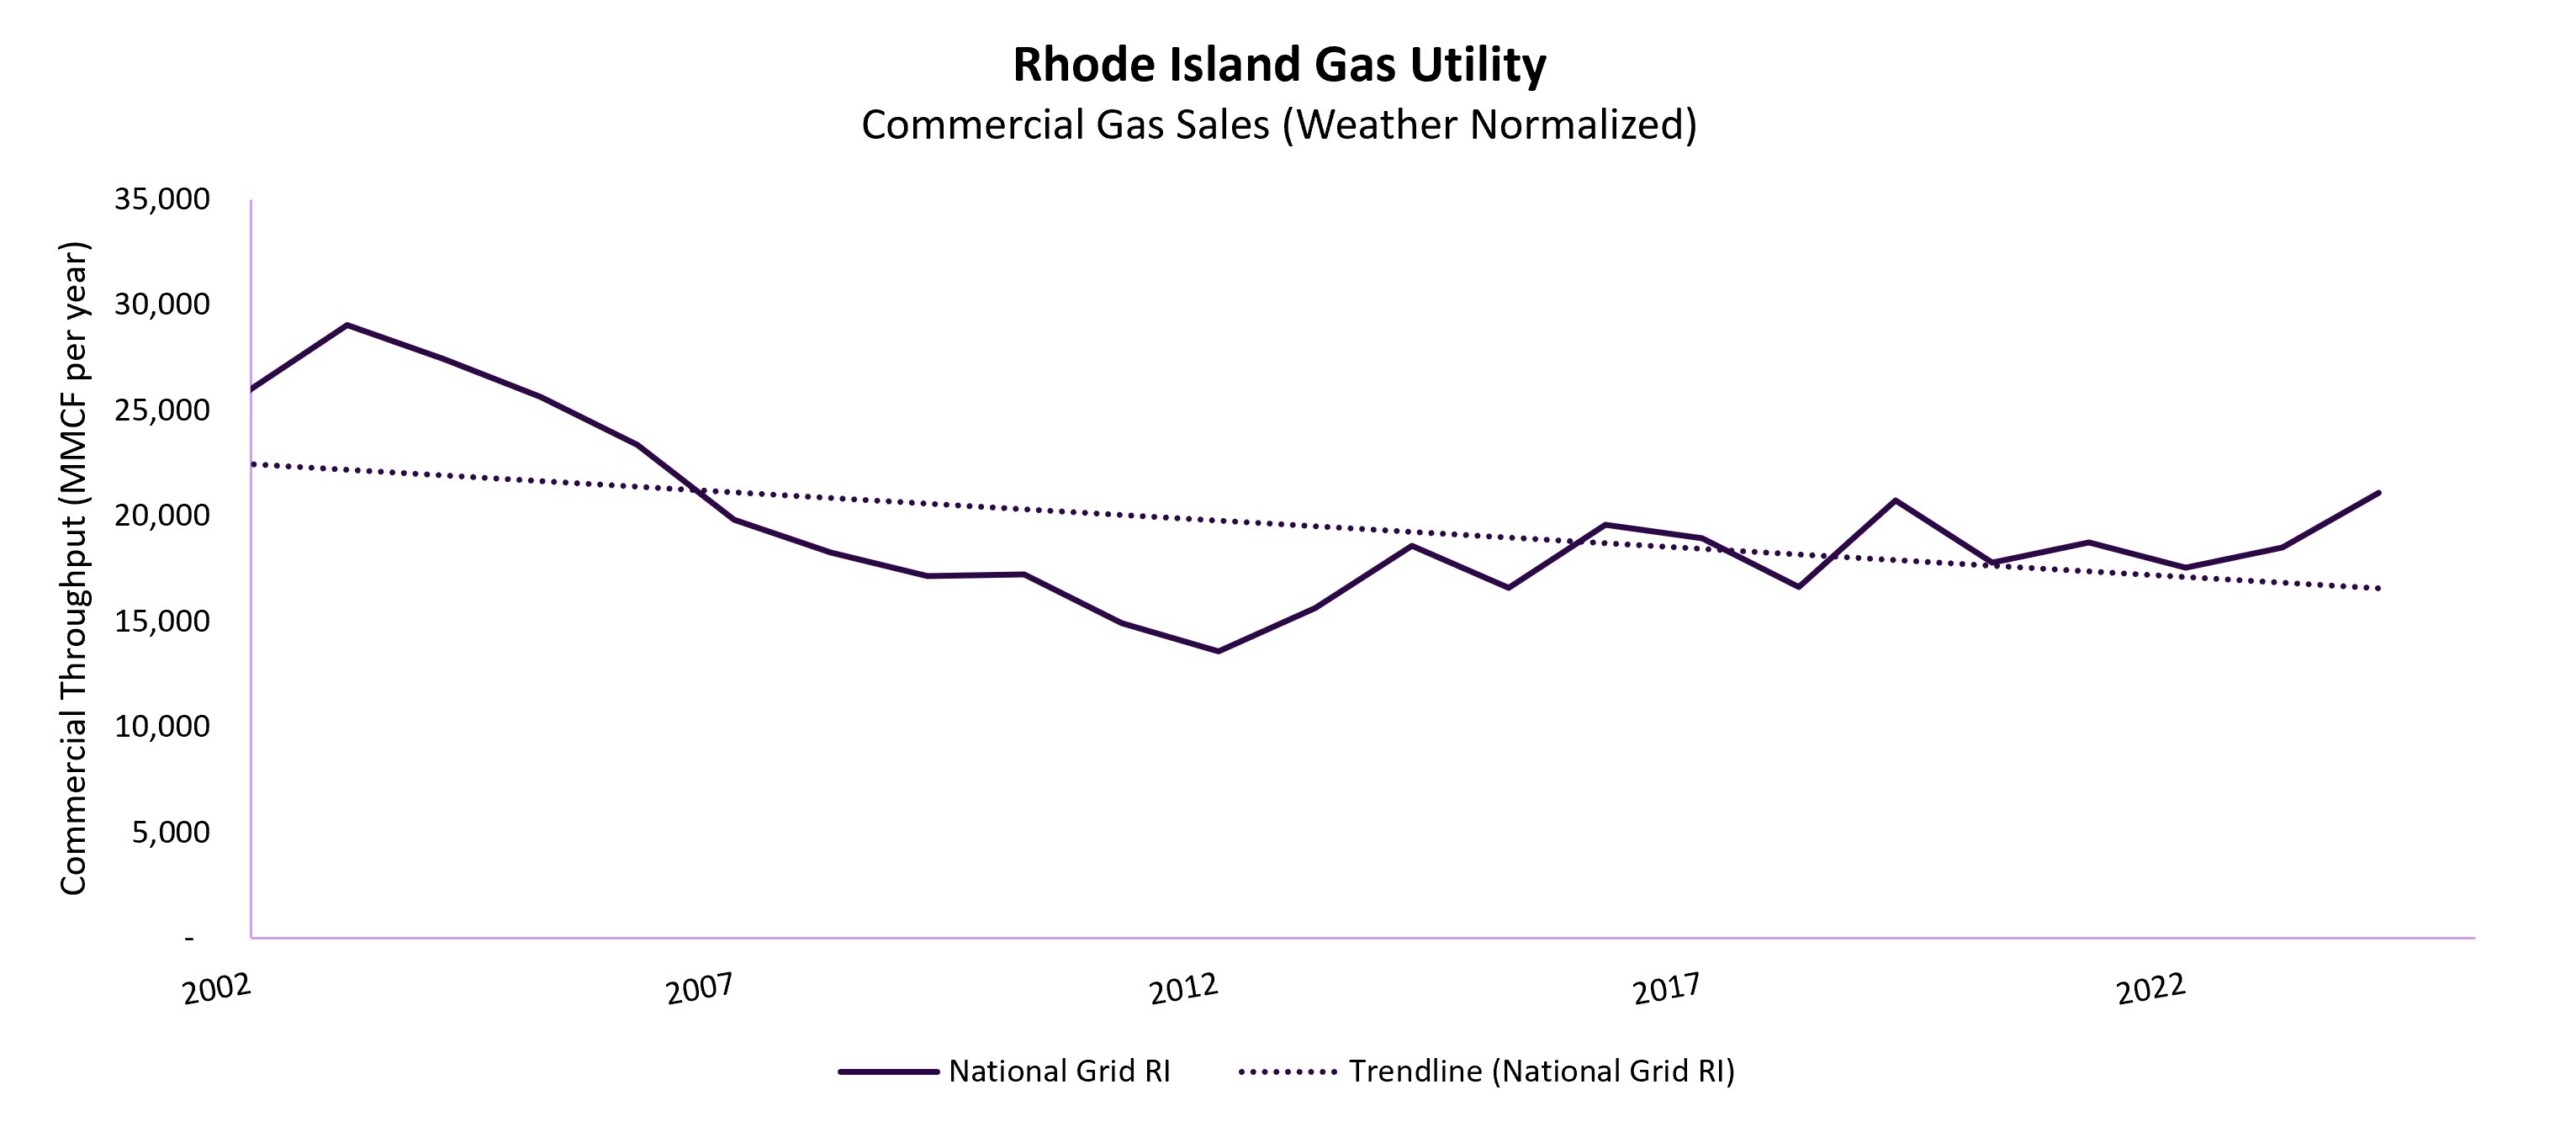
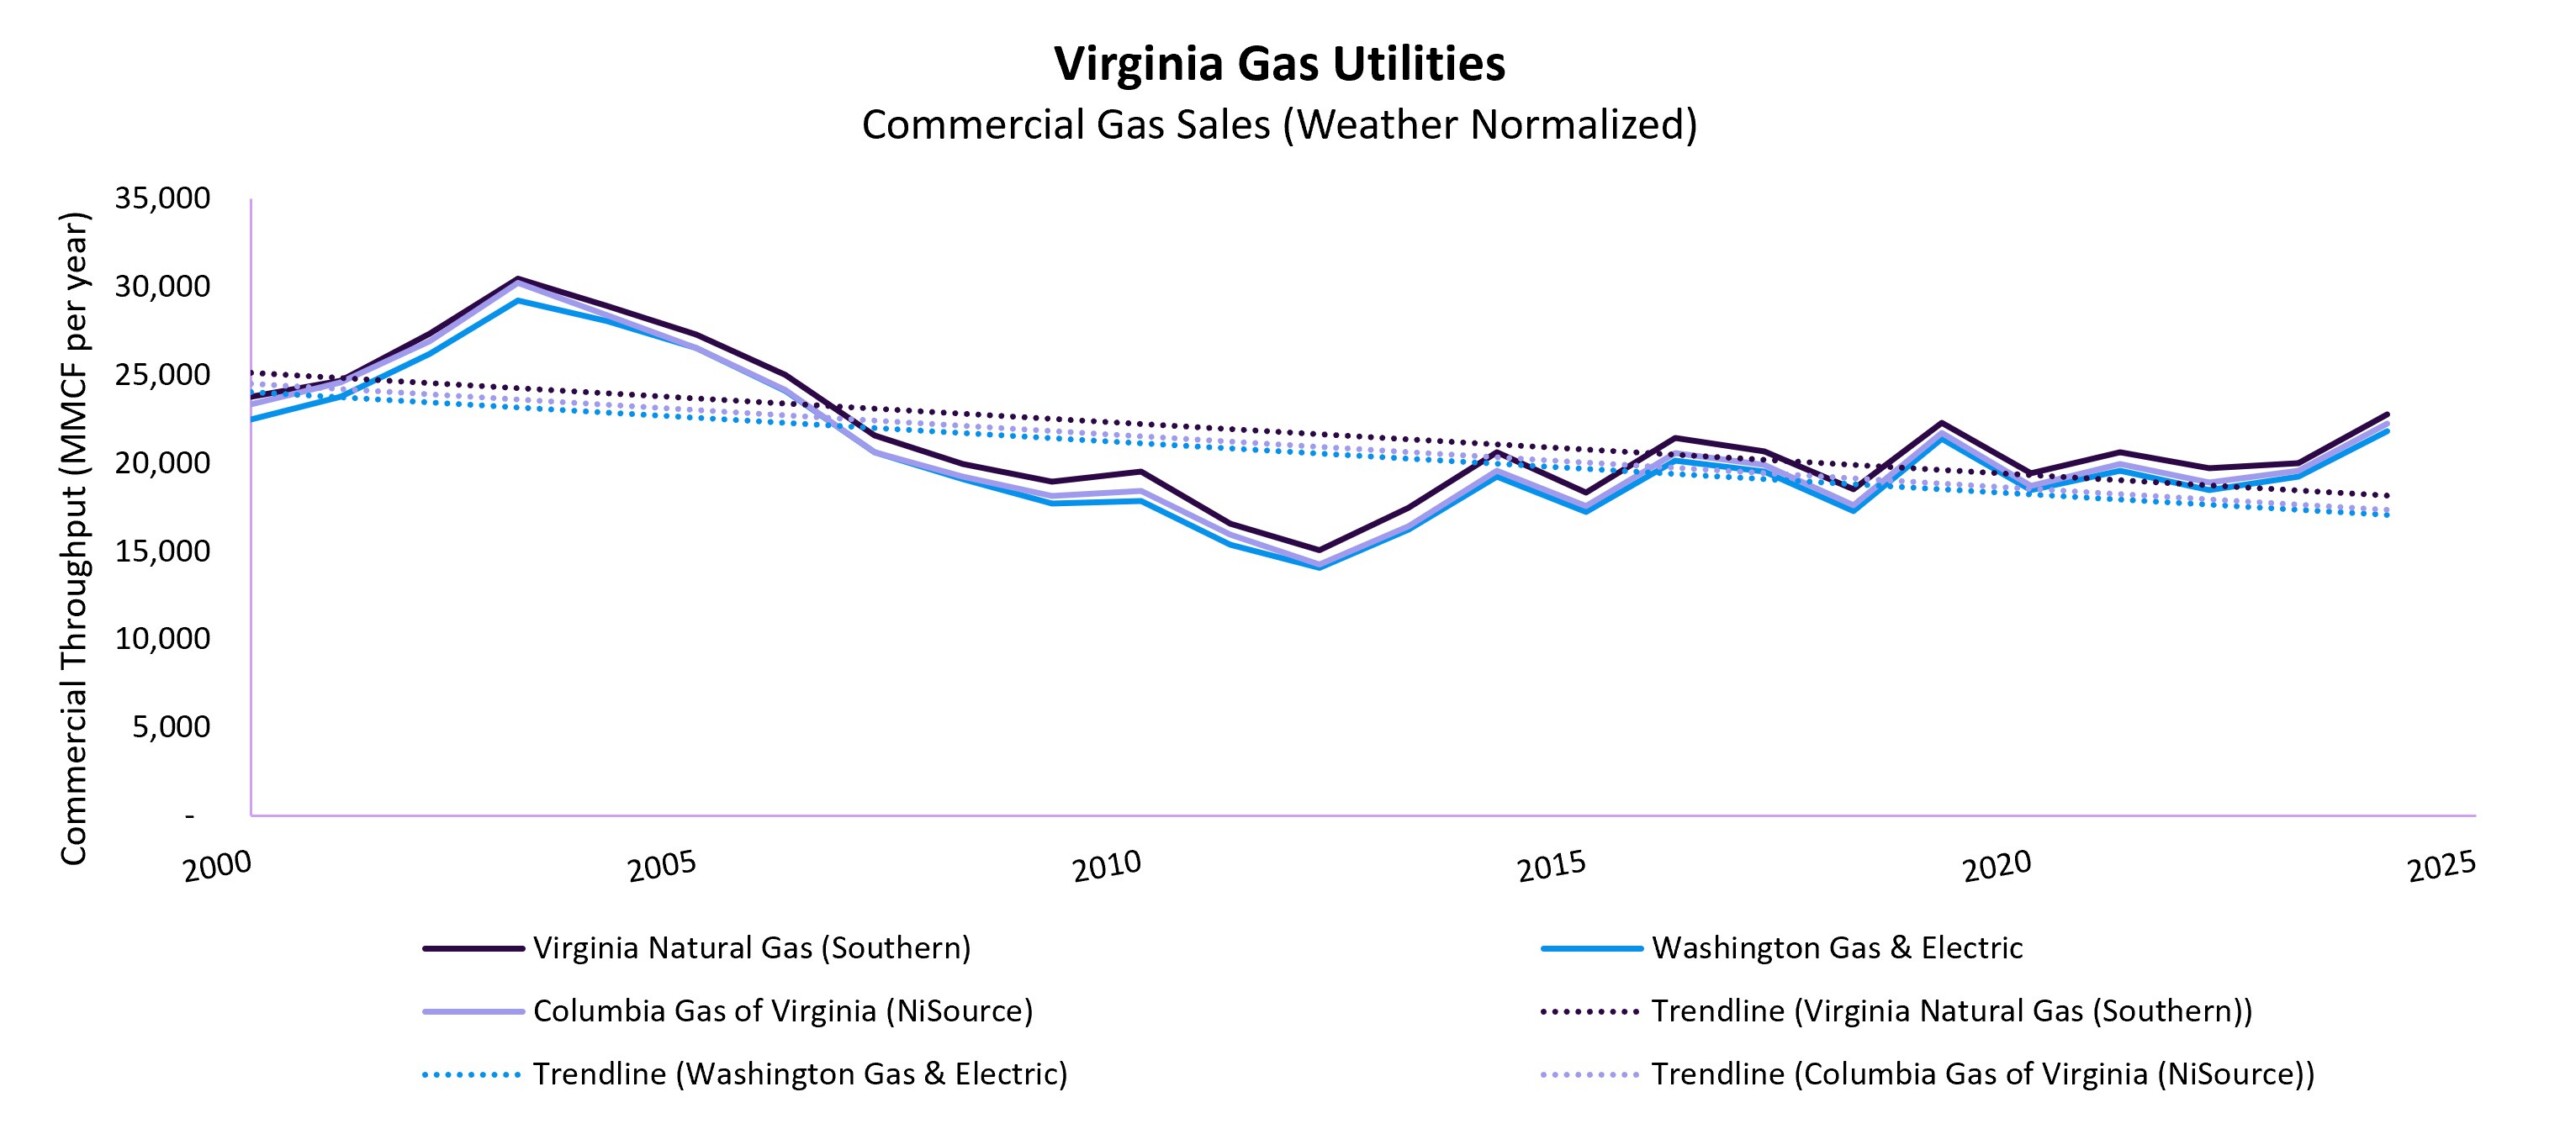
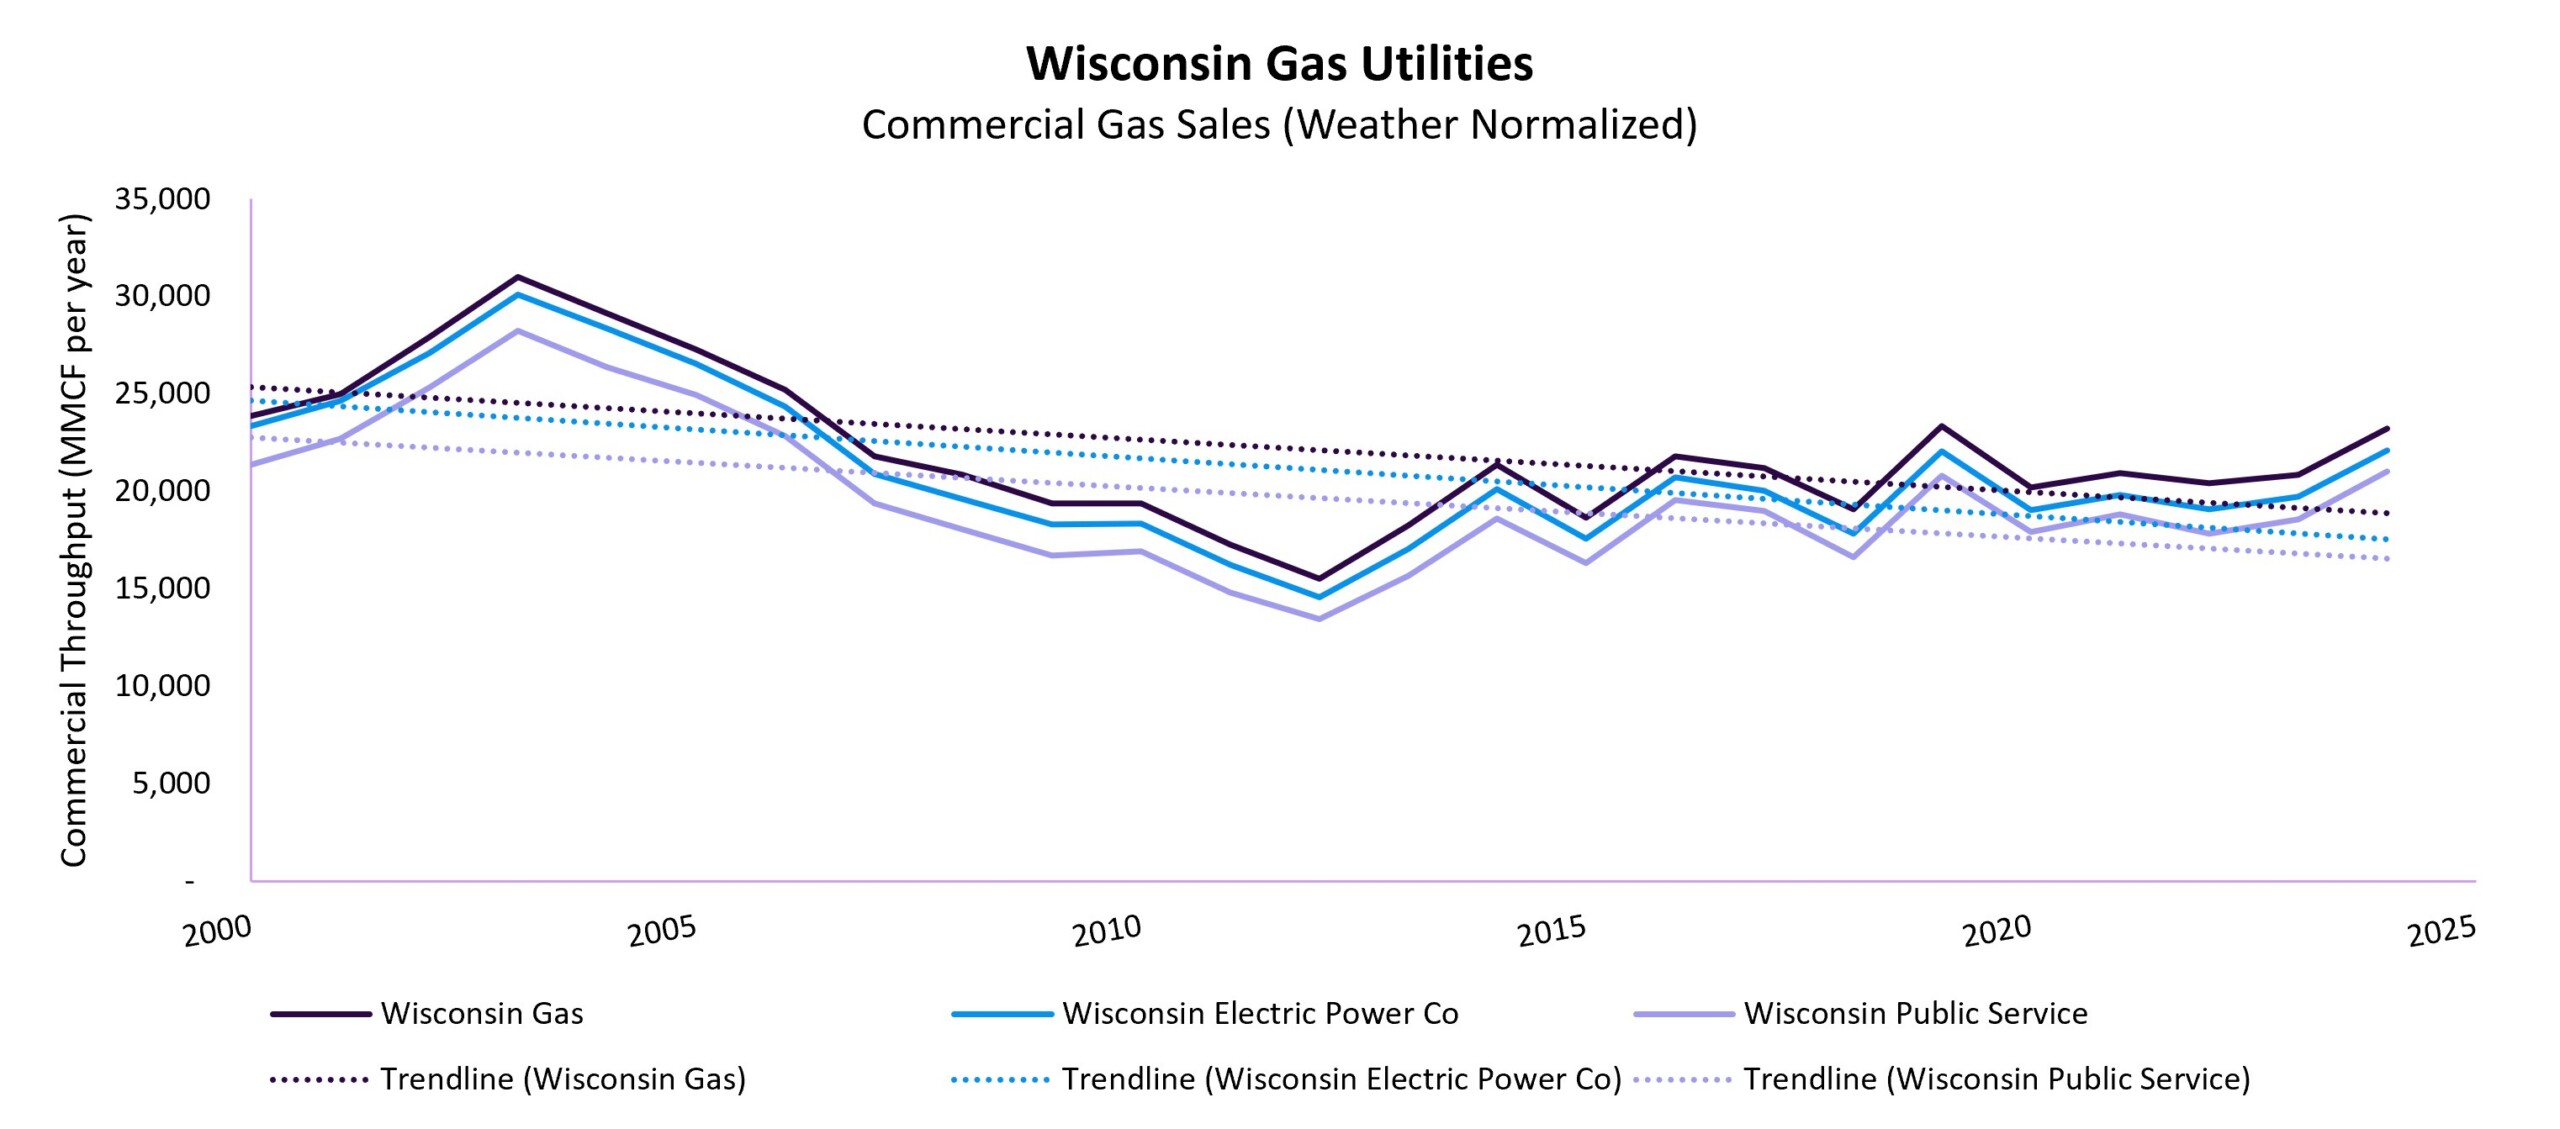
Commercial-sector gas consumption trends sometimes diverge from residential sector trends in the same state. Illinois and New Jersey (PSEG only) appear to have seen longer-term declines in total sales to commercial customers. However, most states’ (weather-normalized) consumption seems to follow a pattern wherein sales increase around 2005, fall and remain relatively flat throughout the 2010s, and then begin to drift upwards between 2020 and 2024. Their 2024 sales are often close in amount to that of 2000. Future data will be important to reinforce – or reverse – our characterization of the long-term pattern.
Recommendations
As shown in the charts above, gas utilities have not experienced major changes to their customer counts or sales over the last decade, through 2024, in either the commercial or residential sectors. However, we know that many of these states have since begun driving towards cleaner and more efficient heating through a variety of policies, including line extension allowance reform, clean heat incentive programs, updated building codes that support all-electric homes, non-pipeline alternatives, and rate design work. Many of those changes are just now beginning to take effect in meaningful ways, and will likely take several years to show up in the data. Also, since 2023, heat pumps have outsold gas furnaces – a trend that has endured despite the rollback of federal tax credits for efficient and electric home upgrades. Over the long term, as appliances reach the end of their life (often ~20 years for furnaces and ~10-15 years for water heaters) and some percentage are replaced with electric alternatives, we anticipate this will further influence the trends we will see in these charts.
Meanwhile, accelerated pipeline spending in a time of flat – let alone declining – sales have major implications for affordability and long-term equity. This new infrastructure is costly and lasts for approximately 50-100 years, depending on the material used. If gas utilities continue to make these types of investments, a declining number of customers would be responsible for paying for pipelines that may not be fully utilized over the pipeline’s lifetime. Even before customer counts decline, partial electrification reduces system throughput and drives up the per-unit price of gas.
At United, we have always believed that states should be taking proactive action to protect customers from bearing out-of-control heating costs during the transition to clean heat. However, the affordability crisis is already upon us, and action should no longer be considered “proactive.” Many of the same solutions to the long-term cost risk of a shrinking gas system apply to the near-term affordability crisis: ending gas line extension allowances, establishing strong long-term gas planning requirements (integrated with electric system planning where possible), pursuing as many lower-cost, lower-risk non-pipeline alternatives (NPAs) as possible (including service line NPAs), and considering other ratemaking reforms, including performance metrics, depreciation reforms, and intersectoral cost recovery.
As states work to contain costs on the gas system, their work to manage costs on the electric side will also provide customers an affordable alternative for their homes or businesses.
United is committed to seeking these policy solutions in states and continuing to monitor the data for signs that interventions are beginning to take effect as intended.
Note: EIA expects to release 2025 utility data in November 2026.